Valgrind web site: https://valgrind.org/
Valgrind is supported on Ubuntu out of the box. (On newer MacOS versions requires manual installation)
- Installing Valgrind using command prompt on Ubuntu VM:
- Ubuntu: $ sudo snap install valgrind --classic
- After the installation is done execute: $ valgrind --version
response should be: valgrind-3.20.0 (or any newer version) - Possible installation issues
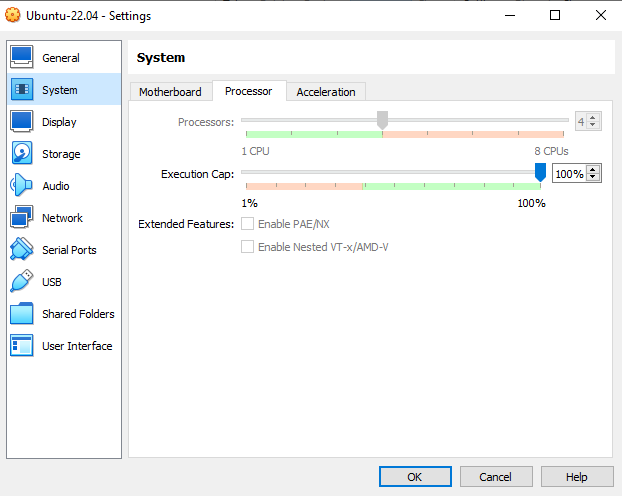
- getting "valgrind: the 'impossible' happened: IA-64 cache detected?!"
- Shut down the VM
- Open the VM settings and make sure the processors slider is not in the red area
- getting "valgrind: the 'impossible' happened: IA-64 cache detected?!"
- Preparing the application under test:
- To be compiled with -g to include debug info. This is the default mode for simulator, so nothing to do.
- Running test with Valgrind
- Baseline test example
- $ valgrind --error-limit=no ./aamp-cli https://bitmovin-a.akamaihd.net/content/MI201109210084_1/mpds/f08e80da-bf1d-4e3d-8899-f0f6155f6efa.mpd
- give it some time as running with valgrind is much slower. For best results can run on a powerful workstation
- after some test time observing audio and video - execute these commands:
- stop
- exit
- Once the aamp-cli process exits - Valgrind will printout in the console the results.
- sample results:
- ==2557==
==2557== HEAP SUMMARY:
==2557== in use at exit: 1,922,526 bytes in 15,071 blocks
==2557== total heap usage: 1,458,652 allocs, 1,443,581 frees, 538,978,697 bytes allocated
==2557==
==2557== LEAK SUMMARY:
==2557== definitely lost: 23,844 bytes in 266 blocks
==2557== indirectly lost: 80 bytes in 2 blocks
==2557== possibly lost: 416 bytes in 1 blocks
==2557== still reachable: 1,823,418 bytes in 14,074 blocks
==2557== suppressed: 0 bytes in 0 blocks
==2557== Rerun with --leak-check=full to see details of leaked memory
==2557==
==2557== For lists of detected and suppressed errors, rerun with: -s
==2557== ERROR SUMMARY: 0 errors from 0 contexts (suppressed: 0 from 0)
- ==2557==
- Detailed test
$ valgrind --leak-check=full --error-limit=no ./aamp-cli <<.mpd URL>>
- sample results log: https://wiki.rdkcentral.com/download/attachments/274989296/valgrind.log?api=v2
- Baseline test example
- Pass/Fail criteria
- Valgrind results will vary based on the usage of the application.
- Make sure to always run the same steps and the same time as the baseline is done when comparing valgrind results with the baseline.
- Need to have a baseline report and compare future reports. Due to the nature of the Valgrind reports - not all reported issues are considered as issues. The goal is to make sure the number of issues is not increasing without a reason, and if it is increased - raise a ticket with the delta.
- Example:
- check if the number of lost blocks has increased from the baseline run
- definitely lost: 23,844 bytes in 266 blocks
- check the remaining output for differences in the identified blocks.
- check if the number of lost blocks has increased from the baseline run
- Possible cases and areas to be considered when developing the test cases with Valgrind
- Can have multiple test cases and use their baseline results for detecting new leaks.
- Can have one test running for different time periods to detect memory leaks accumulation
- Can use aamp-cli cmd line scripting to assure the same steps are executed every time and the timings are the same between different test runs.
- Notes:
- for building and running aamp to run on a device follow the attached document
Overview
Community Forums
Content Tools
Tasks