Introduction
Boot Time includes topics such as measurement, analysis, human factors, initialization techniques, and reduction techniques. Booting up a device involves numerous steps and sequences of events. In other words, Boot time is the time from power on to user start

Measuring Boot time
There are many methods available to measure the time. Few options are
- PRINTK_TIME option in kernel can be used to measure time taken for kernel booting
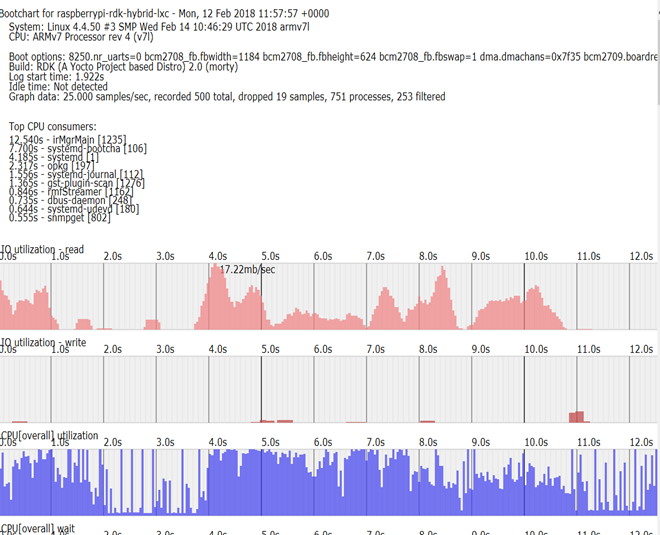
- Bootchart is graphical representation of boot proces.This bootchart can be used to analyse boot process
- Systemd tools (system-analyze,system-bootchart)
Improving the boot performance of a system can provide reduced boot wait times.

Analyzing the boot process using systemd tools
Systemd-analyze
- systemd provides a tool called systemd-analyze that will show timing details about the boot process
- systemd-analyze time
- This tool prints the time spent in the kernel before userspace has been reached, the time spent in the initial RAM disk (initrd) before normal system userspace has been reached, and the time normal system userspace took to initialize.
- System-analyze blame
- This command prints a list of all running units, ordered by the time they took to initialize.

- This command prints a list of all running units, ordered by the time they took to initialize.
- System-analyze critical-chain
- This command prints a tree of the time-critical chain of units

- This command prints a tree of the time-critical chain of units
- System-analyze plot > plot.svg
- This command prints an SVG graphic detailing which system services have been started at what time, highlighting the time they spent on initialization.

Systemd-bootchart
- Systemd-bootchart command collects the CPU utilization, disk load, memory usage, as well as per-process information from a running system.Systemd-bootchart is available only in morty version (yocto 2.2)
- Kernel Config
- For systemd-bootchart to work ,the following kernel configuration is required
CONFIG_SCHEDSTATS
- Graph Location
- After collecting a certain amount of data (configurable) the logging stops and a graph is generated from the logged information. Collected results are output as an SVG graph. By default, the configuration file in /etc/systemd/ contains commented out entries showing the defaults as a guide to the user. This file can be edited to create local overrides.
- It is essentially a more detailed version of the systemd-analyze plot function.Bootchart graphs are by default written time-stamped in /run/log
- Bootchart service is disabled by default. In order to collect the information, service has to be enabled first
- # systemctl enable systemd-bootchart
- # systemctl start systemd-bootchart

References
Overview
Community Forums
Content Tools
Tasks