WIP
Introduction
CPUProcAnalyzer runs periodically to collect cpu utilisation,load average and memory usage. It would help us in detecting the memory leaks, cpu and memory performance regressions.
Scope of the work
RDK PROC ANALYZER is a tool that enables different teams like development, triage and testing to analyze the CPU and memory utilization of the processes that run on top of RDK framework and helps us in detecting the memory leaks, cpu and memory performance regressions. This tool is implemented as a service and is also highly configurable( Parameters like period , time interval and processes to be monitored can be configured).
High level Design / Architecture
Sanity Testing
1. How to Configure:
Before Configuring we need to trigger the build with the below change :
https://code.rdkcentral.com/r/c/rdkb/components/opensource/ccsp/TestAndDiagnostic/+/91839 - round trip
Configure the below parameters
dmcli eRT setv Device.SelfHeal.CPUProcAnalyzer.SleepInterval uint 60

dmcli eRT setv Device.SelfHeal.CPUProcAnalyzer.TimeToRun uint 600

dmcli eRT setv Device.SelfHeal.CPUProcAnalyzer.MemoryLimit uint 1536

dmcli eRT setv Device.SelfHeal.CPUProcAnalyzer.MonitorAllProcess bool 0

dmcli eRT setv Device.SelfHeal.CPUProcAnalyzer.DynamicProcess bool 0

dmcli eRT setv Device.SelfHeal.CPUProcAnalyzer.ProcessList string OneWifi

dmcli eRT setv Device.SelfHeal.CPUProcAnalyzer.ProcessStatsToMonitor string cpu,memory,fd,thread

dmcli eRT setv Device.SelfHeal.CPUProcAnalyzer.SystemStatsToMonitor string cpu,memory,fd,loadavg,cliconnected

dmcli eRT setv Device.SelfHeal.CPUProcAnalyzer.TelemetryOnly bool 0
Next we need to check whether these parameters are configured in this file or not (/nvram/cpuprocanalyzer.ini). As a next step we need to configure the below :
- If the below value returned is false, then run:
sysevent set UPLOAD_LOGS_VAL_DCM true - Enable the tool via:
dmcli eRT setv Device.SelfHeal.CPUProcAnalyzer.Enable bool true
2. How to view results:
1.After enabling the CPUProcAnalyzer we can able to see the below log which is having the details of the memory utilization of a particular process, deviceInfo & loaded memory data.
2.Check for log upload with uploaded file having keyword as "CPAstats" in Consolelog.txt.0 log file. For ex :
E45F01F41423_CPAstats_08-25-23-09-28AM.tgz |
3.Copy the E45F01F41423_CPAstats_08-25-23-09-28AM.tgz filename, and download the tar file via https://rdkanalyticsportal.stb.r53.xcal.tv/home/#/logs/file
4.Unzip the content of the downloaded file to any folder of your choice, then go inside tmp.
5.Inside tmp, folder named cpuprocanalyzer shall be present. Create a zip of that.
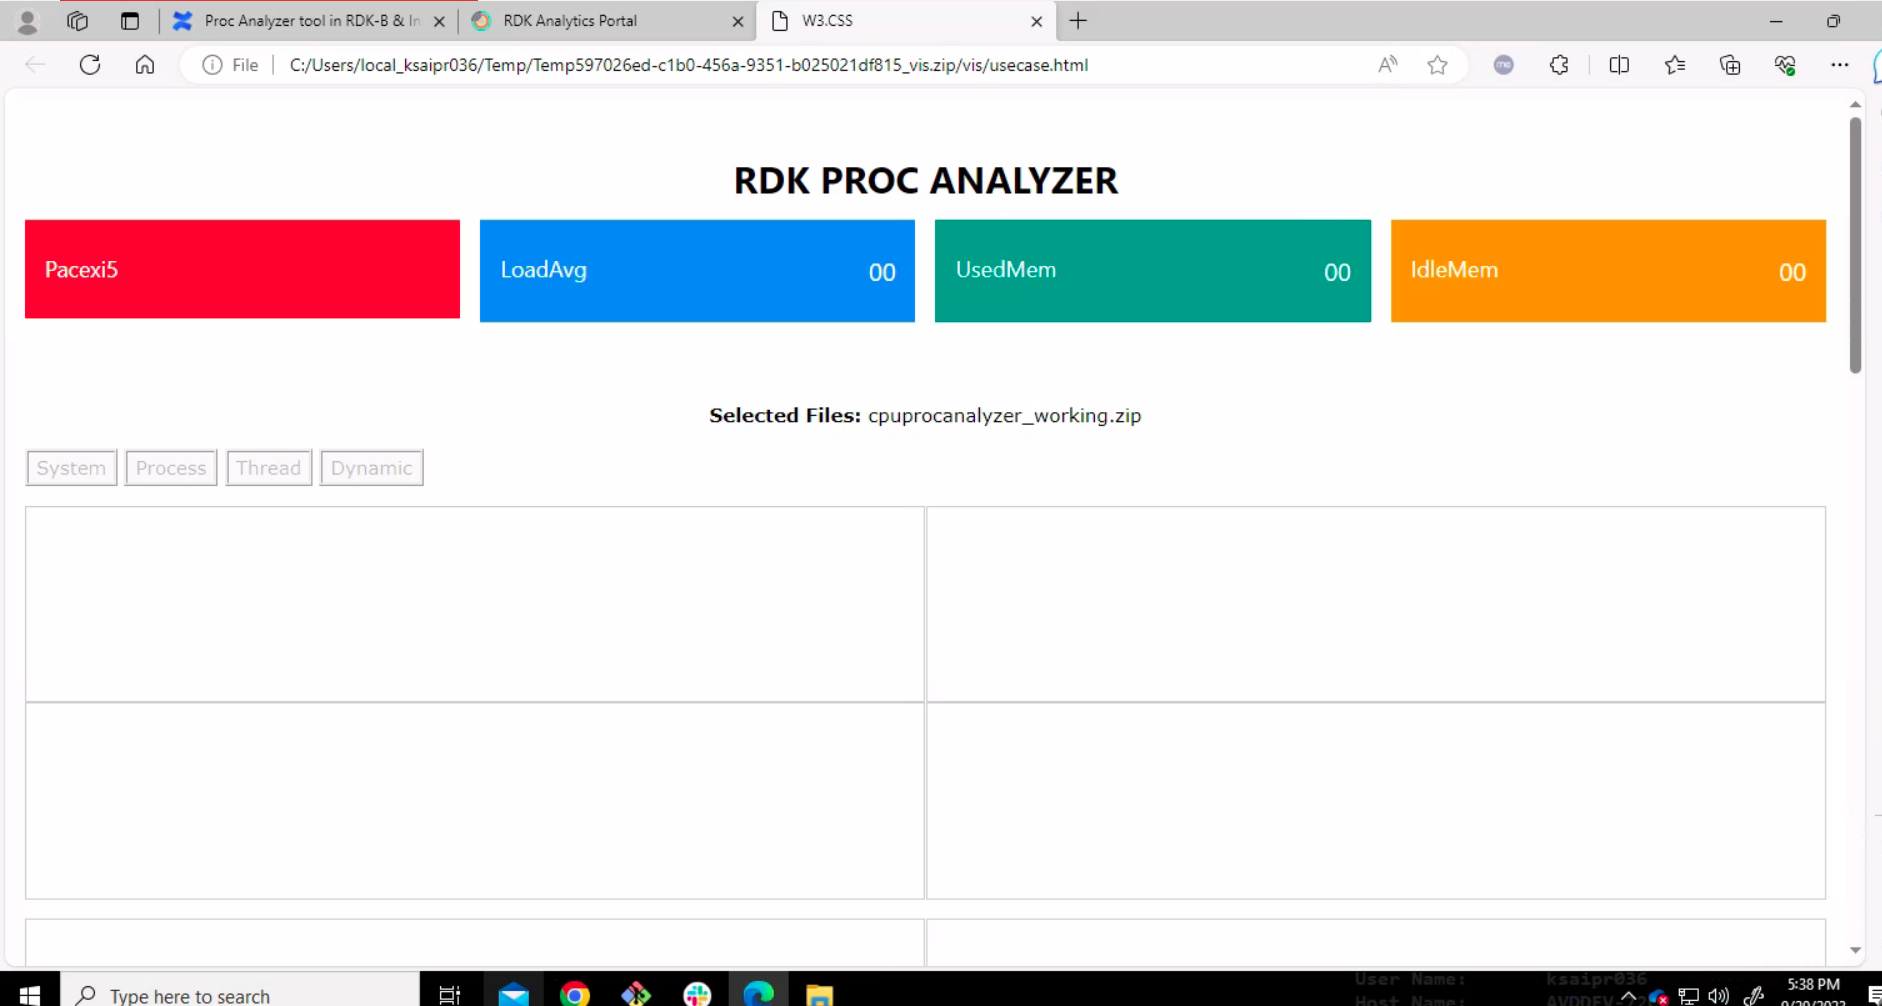
3. Visualizer:
Visualizer is a simple html file.( Load usecase.html file from the vis.zip folder) vis.zip
To visualize the result, upload the file cpuprocanalyzer.zip (as created in Step 5 of "How to view results") to the usecase.html, the steps of opening usecase.html are given below.
Visualizer has four options available namely System, Process, Thread and Dynamic.
1.System: It gives us the plots of system level statistics of cpu and memory utilization.
2.Process: It has two kinds of views.
It has two dropdowns available one to choose the parameter and the other to choose the process.
If no process is chosen it gives the plot of top processes of the selected parameter and any process is chosen it gives
us the plot of the chosen process of particular parameter.
3.Thread: It also has two dropdowns one to choose the process and the other to choose the thread.
This gives the cpu utilization of selected thread of the selected process.
4.Dynamic: This view shows us the memory statistics of the dynamic processes in a tabular format.
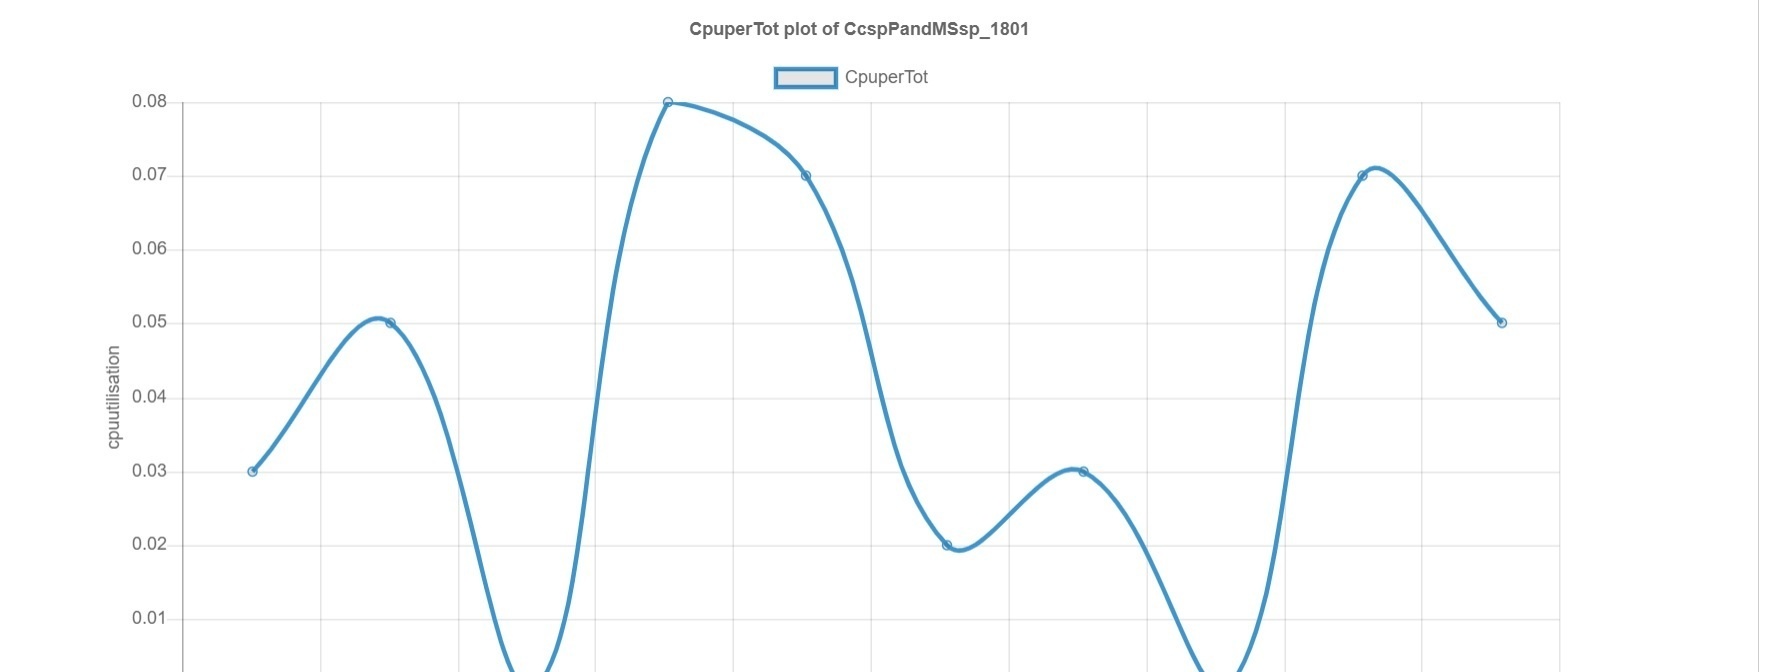
Snapshots of Visualizer:
Below snapshots are from CcspPandM Process:


References
https://etwiki.sys.comcast.net/pages/viewpage.action?pageId=729794950
EPIC/User Stories
Overview
Community Forums
Content Tools
Tasks