RDK Resources
[*RDK Preferred*]
Code Management Facility
RDK Forums
[RDK Conferences]
RDK Support
Archives
Papers & Presentations Archive![]()
Papers & Presentations Archive![]()
...
"telemetryProfile": [{
    "header": "SYSbootuptime_SHClientConnectComplete_WIFI_restartsplit",

    "content": "WIFI_process is not runningClient_Connect_complete:",

     "type": "SelfHealLM.txt.0log",

     "pollingFrequency": "0"
 },
Updated marker with event feed as the source; "type" and "content" field are changed:
"telemetryProfile": [{
  "header": "SYSbootuptime_SHClientConnectComplete_WIFI_restartsplit",
   "content": ""com.cisco.spvtg.ccsp.wifiagent"ccsp-lm-lite",
   "type": "<event>",
   "pollingFrequency": "0"
},
...
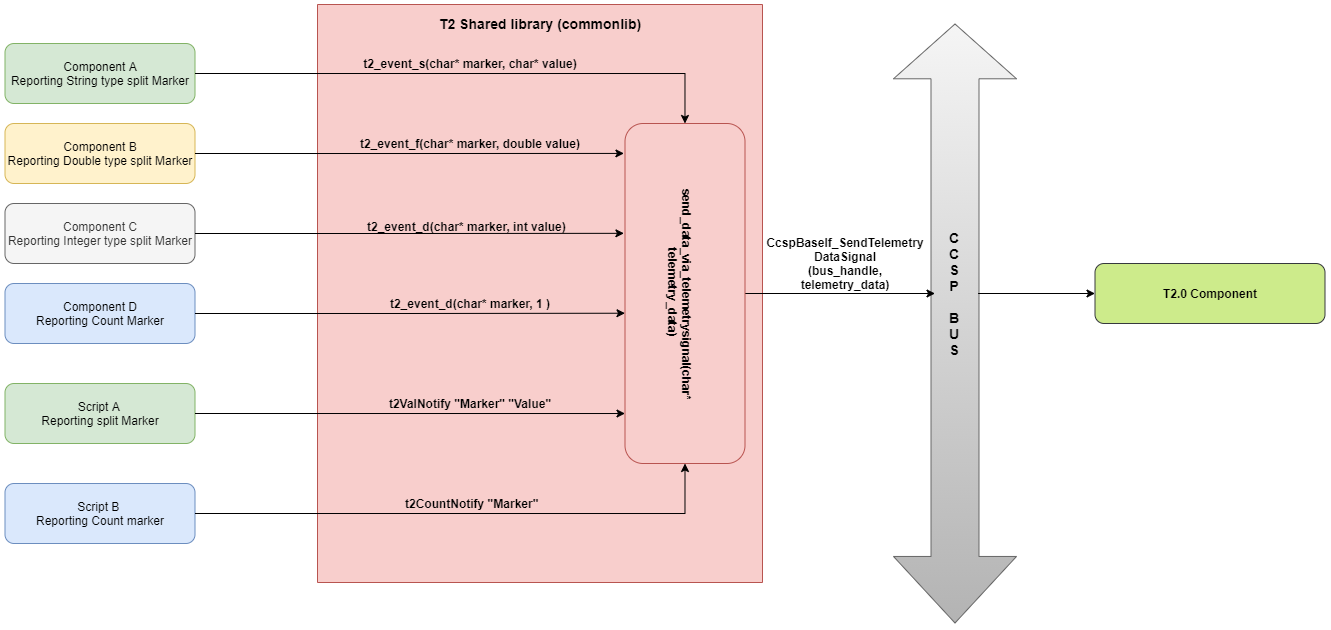
A shared library is used by components to send targeted marker occurrences through an event feed to the T2 component.Components using the shared library shall conditionally compile it in via #if defined(ENABLE_FEATURE_TELEMETRY2_0) in order to support platform-specific compilation.When the T2 component receives a marker event it processes the marker name and value according to the Use definition in the report profile. The T2 component will store absolute as received, accumulate, or aggregate values. Marker events are processed per report profile.
When a report is generated markers that were processed from the event feed are included in the report as specified by the report profile.
Gliffy Diagram macroId 87fb0e2b-c598-43e3-978b-05f205fa4310 name T2 overview pagePin 1
...
.
Gliffy Diagram macroId 87fb0e2b-c598-43e3-978b-05f205fa4310 name T2 overview pagePin 1
•APIs for component metrics and events
| t2_event_s(char*eventName, char* value) t2_event_d(char*eventName, int value) t2_event_f(char*eventName, double value) |
|---|
| S.NO | DataModel | Description | DataType |
|---|---|---|---|
| 1 | Device.DeviceInfo.X_RDKCENTRAL-COM_RFC.Feature.Telemetry.Enable | Enable the T2 Process | Boolean |
| 2 | Device.DeviceInfo.X_RDKCENTRAL-COM_RFC.Feature.Telemetry.Version | ‘2.0’ : Operates only with legacy support | String |
| 3 | Device.DeviceInfo.X_RDKCENTRAL-COM_RFC.Feature.Telemetry.ConfigURL | https://xconf.xcal.tv/loguploader/getT2Settings | String |
T2 Report Profile
| S.NO | DataModel |
|---|
| Description | DataType | |
|---|---|---|
| 1 | Device. |
| X_RDKCENTRAL-COM_ |
| T2.ReportProfiles | Value must be a JSON configuration blob | String |
| 2 | Device |
| .X_RDKCENTRAL-COM_ |
‘2.0’ : Operates only with legacy support
‘2.0.1’ : Operates with T2 report profile and legacy support
T2 Report Profile
...
| T2.ReportProfilesMsgPack | Value must be a JSON configuration blob in base 64 encoded msgpack format | String |
The markers are of 3 types .
1.Split based markers.
2. Count based markers
3. TR-181 based markers.
Marker Type | Sample configuration from xconf | Description with respect to sample configuration |
|---|---|---|
| Count based markers | {"header":"RF_ERROR_IPV4PingFailed","content":"Ping to IPv4 Gateway Address are failed","type":"SelfHeal.txt.0","pollingFrequency":"0"} | Expects the occurrence count of content "Ping to IPv4 Gateway Address are failed" |
| Split based markers | {"header":"bootuptime_ClientConnectComplete_split","content":"Client_Connect_complete: |
The markers are of 3 types .
1.Split based markers.
2. Count based markers
3. TR-181 based markers.
Marker Type | Sample configuration from xconf | Description with respect to sample configuration |
|---|---|---|
| Count based markers | {"header":"RF_ERROR_IPV4PingFailed","content":"Ping to IPv4 Gateway Address are failed","type":"SelfHealLM.txt.0log","pollingFrequency":"0"} | Expects the occurrence count of content "Ping to IPv4 Gateway Address are failed"value after content "Client_Connect_complete:" |
| TR-181 Split based markers | {"header" : "bootuptime_ClientConnectCompleteCMMAC_split","content" : "Client_Connect_complete:","type":"LM.txt.log","pollingFrequency":"0"} | Expects the value after content "Client_Connect_complete:" |
| TR-181 based markers | {"header" : "CMMAC_split","content" : "Device.DeviceInfo.X_COMCAST-COM_CM_MAC","type" : "<message_bus>","pollingFrequency":"48"} | Markers whose type is configured as "<message_bus>" |
In T2.0, the aim is to instrument possible number of split and count based markers from component side. These are termed as event markers. Can be classified as one more type under the classification of markers.
Once a marker is instrumented from component side, its configuration on xconf will be changed from the configured file name to "<event>" in 'type:' section.
Example:
...
| Device.DeviceInfo.X_COMCAST-COM_CM_MAC","type" : "<message_bus>","pollingFrequency":"48"} | Markers whose type is configured as "<message_bus>" |
In T2.0, the aim is to instrument possible number of split and count based markers from component side. These are termed as event markers. Can be classified as one more type under the classification of markers.
Once a marker is instrumented from component side, its configuration on xconf will be changed from the configured file name to "<event>" in 'type:' section.
Example:
{"header":"bootuptime_ClientConnectComplete_split","content":"ccsp-lm-lite","type":<event>","pollingFrequency":"0"}
Find the correct place to report a marker .
Previously in DCA telemetry, a marker is reported based on the xconf configured "content" string - when the content string is found in corresponding configured filename configured under 'type:' section .
/* Refer : {"header": "WIFI_INFO_Hotspot_client_connected", "content": "Added case, Client with:", "type": "Hotspotlog.txt.0","pollingFrequency":"0"} */
In https://code.rdkcentral.com/r/c/rdkb/components/opensource/ccsp/hotspot/+/35833/3/source/hotspotfd/cosa_hotspot_dml.c (Line number 85 gives the idea)
CcspTraceInfo(("Added case, Client with MAC:%s will be added\n", l_cMacAddr));
Example: t2_event_d("WIFI_INFO_Hotspot_client_connected", 1); in https://code.rdkcentral.com/r/c/rdkb/components/opensource/ccsp/hotspot/+/35833/3/source/hotspotfd/cosa_hotspot_dml.c
Example : t2_event_s("acs_split", pStr); in https://code.rdkcentral.com/r/c/rdkb/components/opensource/ccsp/CcspTr069Pa/+/35825/4/source-embedded/DslhManagementServer/ccsp_management_server_pa_api.c line 585
Use appropriate APIs to event markers and values.
In RDKB we have logs coming from both scripts and component's code (code in C). From which markers are reported/grepped.
List of APIs :
Usage: t2_event_s("xh_mac_3_split", "xh_MAC_value”);
t2_event_s("xh_mac_3_split", strBuff); /* where strBuff contains the string value to be reported for this marker */
Sample Reviews:
https://code.rdkcentral.com/r/c/rdkb/components/opensource/ccsp/CcspWifiAgent/+/30422/1/source/TR-181/sbapi/wifi_monitor.c where telemetryBuff is a an array of characters declared, reset and copied with string value to be reported.
https://code.rdkcentral.com/r/c/rdkb/components/opensource/ccsp/CcspTr069Pa/+/35825/4/source-embedded/DslhManagementServer/ccsp_management_server_pa_api.c where pStr is a buffer already used in the code.
NOTE: The instrumented component could use a static buffer or do a buffer malloc itself; but T2 common lib makes its own copy regardless, so instrumented component must clean up after itself.
Must Check Notes
1.While instrumenting components
2. While instrumenting Scripts
Source the utility script /lib/rdk/t2Shared_api.sh
Invoke :
t2ValNotify "Marker" "Value" - To report split based markers
t2CountNotify "Marker" - To report count based markers.
Example: Refer https://code.rdkcentral.com/r/c/rdkb/components/opensource/ccsp/sysint/+/38359/8/uploadRDKBLogs.sh
A Telemetry 2.0 Report Profile is a configuration, authored in JSON, that can be sent to any RDK device which supports Telemetry 2.0. A Report Profile contains properties that are interpreted by the CPE in order to generate and upload a telemetry report. These properties define the details of a generated report, including:
...