INTRODUCTION
Telemetry is a feature used in RDK broadband Gateway devices to extract and upload specific error logs or event logs from the Gateway to the Splunk server. These logs are used to remotely monitor the Gateways in the field.
The logs to be monitored and the frequency of capturing the logs can be configured from the Xconf server, in the form of a marker.
RDK-B Telemetry Architecture
 `
`
Design consideration:
For the Telemetry feature, there are 2 servers maintained.
- Xconf server – To store the configurations
- Splunk server – To store the logs uploaded from the Gateways.
Telemetry data flow
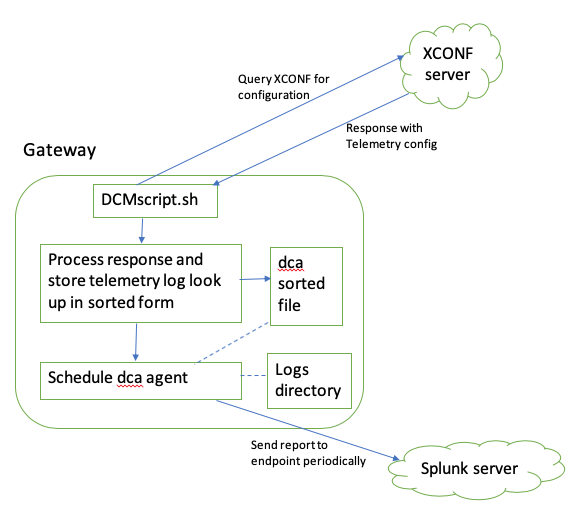
- Every Gateway is registered with the Xconf server. The Gateway executes “DCM script” on boot up. When the Gateway is connected to the server, it queries for the Configuration. Xconf server responds with the predefined markers which includes the information like the logs to be monitored, the log file name, polling frequency, etc.
- The “DCM script” processes the markers and prepares a “sorted map file” for the log look up and then schedules a “dca agent” at every 1 minute.
- The “dca agent” takes the “sorted map file” and the “Logs directory” as input and extracts the logs.
- It then uploads the logs to the Splunk server periodically.
Marker
A marker provides the errors or events appearing in the RDK logs. These markers are predefined in the Xconf server. These markers are set based on the events or errors that need to be monitored for any device.
Each marker contains 4 fields:
- Header: This is a User defined field which describes the error or event.
- Content: This provides the error or event as it appears in the RDK logs.
- Type: This provides the log file name which may have the above error or event log.
- Frequency: This provides the skip frequency, that means the number of times we want to skip the above error / event. If this is “0”, each instance of the event is captured and none of them are skipped.
Marker example
{
“header”: “WIFI_ERROR_WIFI_NOT_Registered”,
“content”: “System Not Ready !!!! ‘com.cisco.spvtg.ccsp.wifi’ v1 NotRegistered”,
“type”: “CRlog.txt.0”
“frequency”: “0”
}
Limitations:
- The Comcast Xconf server and Splunk server are not available.
- Instead of Comcast Xconf server CMF Xconf server is used.
- Instead of Splunk server, a TFTP server is used.
- RPI will support only tftp protocol for upload. No http protocol support is provided yet
- So far no support added to upload dca_sorted_file.conf to http server since tftp server alone is used for RPI Telemetry support till now
- In Comcast Gateways, around 700 markers are supported. Here, currently, only 5 markers are supported. Please refer to user manual Telemetry(1.0) in RPI User manual Broadband - 2019 M9 for markers definition
Future Enhancements:
- To add support for creating a cron job to schedule periodic log collection and upload.
- To add log collection scheduling frequency settings in Xconf server.
![]()