RDK Resources
[*RDK Preferred*]
Code Management Facility
RDK Forums
[RDK Conferences]
RDK Support
Archives
Papers & Presentations Archive![]()
Papers & Presentations Archive![]()
| Children Display |
|---|
| Table of Contents |
|---|
Telemetry is the automatic recording and transmission of data from remote or inaccessible sources to an IT system in a different location for monitoring and analysis.
1. Xconf Server
2. Rpi Board with RDK Broadband image
3. Tftp Server
| draw.io Diagram | ||||||||||||||||||
|---|---|---|---|---|---|---|---|---|---|---|---|---|---|---|---|---|---|---|
|
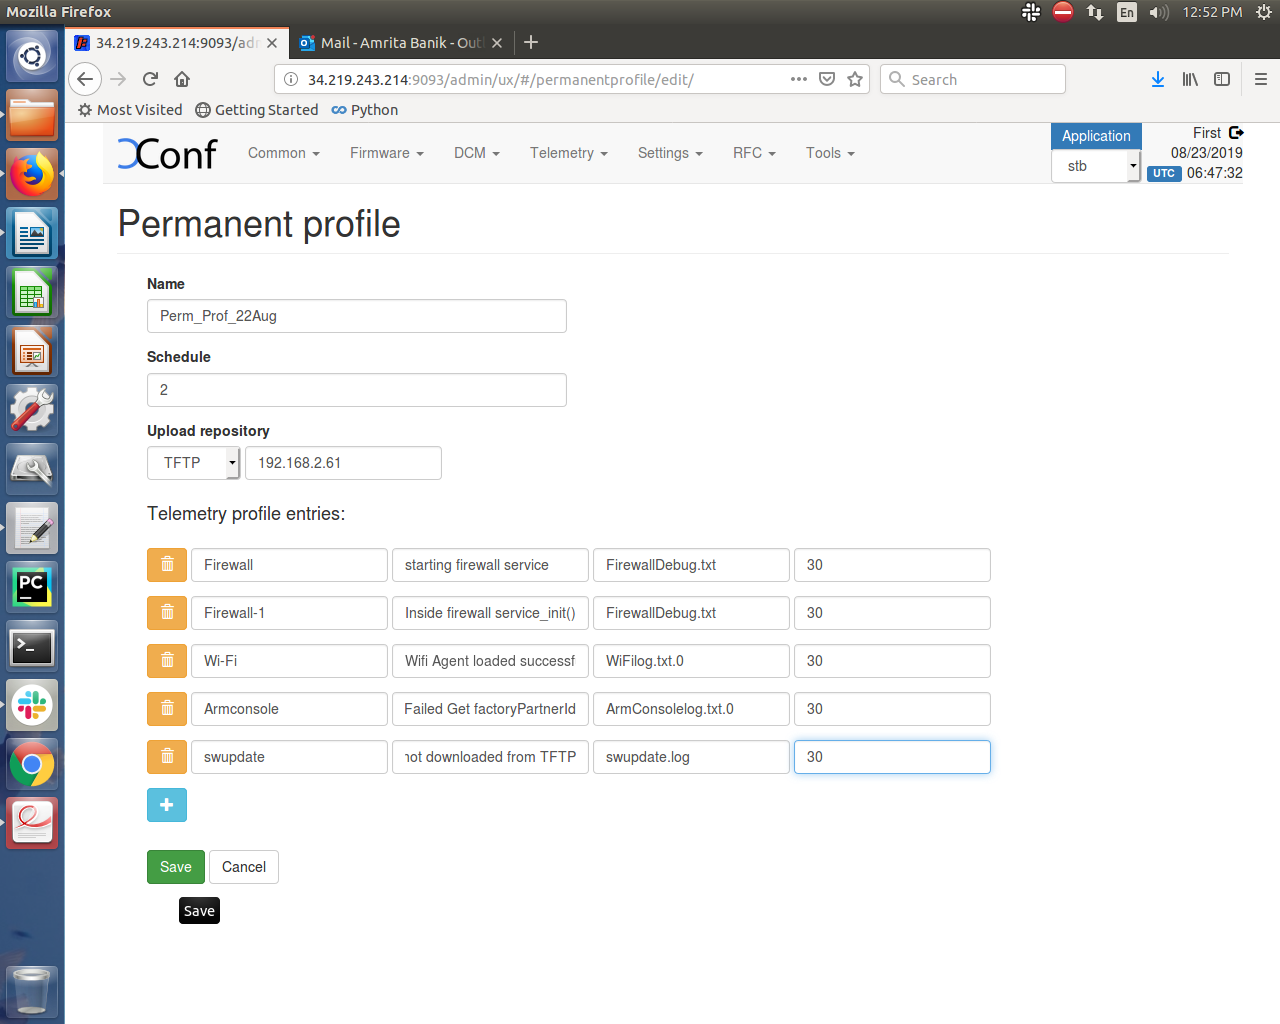
Rpi board will connect to Xconf Server to get the device configuration information, telemetry profile information and log upload repository (ip address of tftp server). It will search for the markers (contents mentioned in the permanent profile) in the mentioned log file. If it is found in the log file, it will process those information and create a text file and upload that file in the tftp server. This way all the critical data related to device health will be available on timely basis in the tftp server for further analysis.
1. Login to Xconf Server and go to DCM menu item and click on “Formulas” sub menu
...
First field is “Header” - This is the name for the particular logs collection. This is a custom name and can be decided based on the use case or error condition or any other scenario.
Second field is “Content” - This is the "log message string" that appears in the RDK logs.
Third field is “type” - This is the name of the log file where the above log message string needs to be searched.
Fourth field is “Skip frequency” - This is a skip frequency. It can have values like 0, 1, 2 etc.
0 - This particular log message is never skipped.
1 - Skip every alternate occurrence of this log message.
2 - Skip 2 consecutive log message occurrences and then collect 1 occurrence and then again skip 2 occurrences.

Based on the R-Pi board supported markers available,we have selected few of them as mentioned below:
...
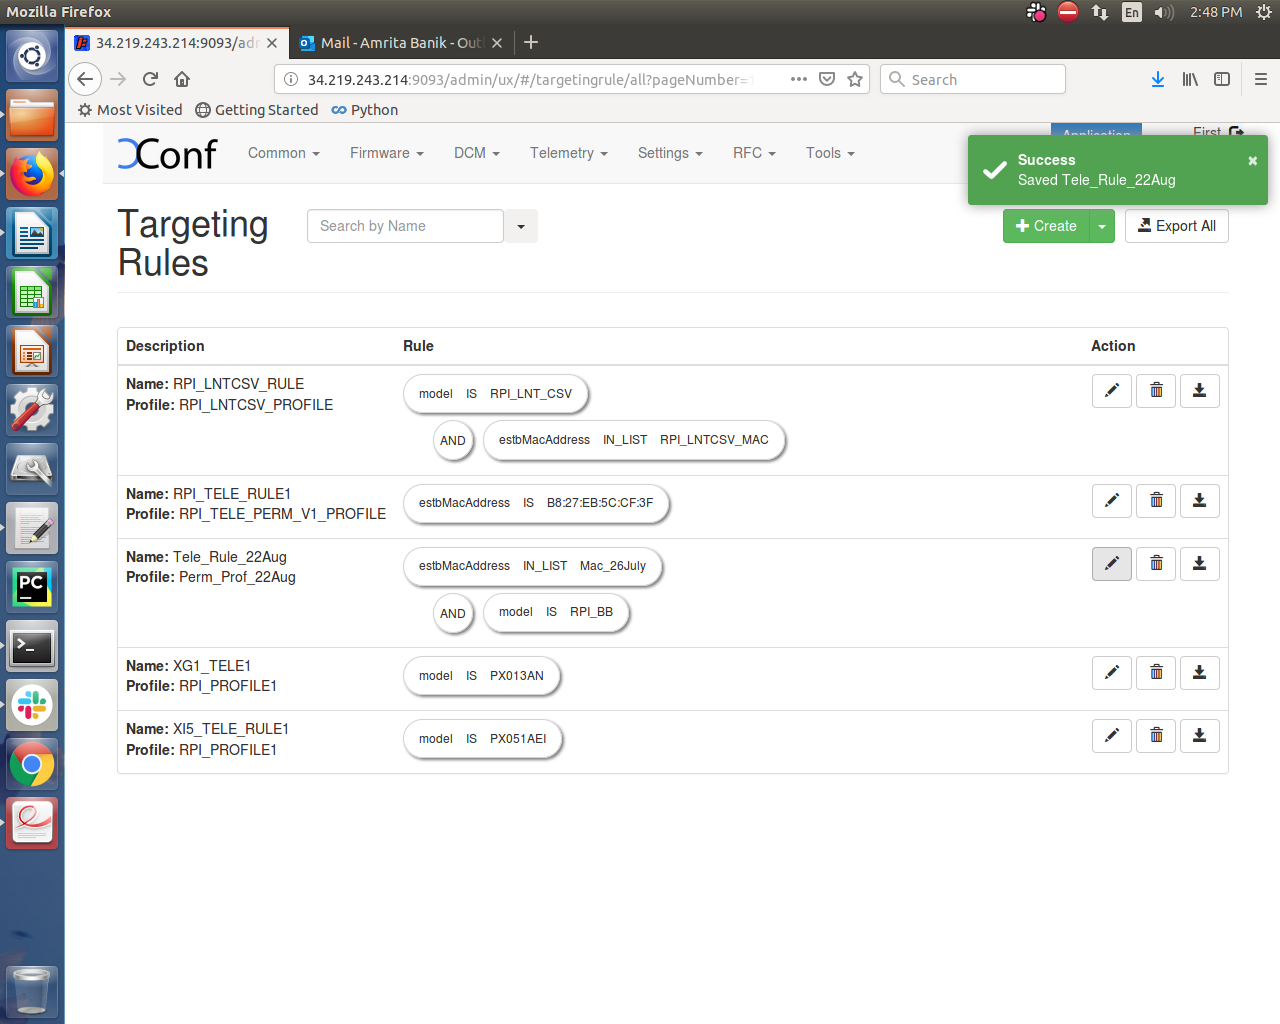
19. Verify the created Targeting rule displayed on the Targeting rule page
Below steps needed after flashing for the first time:
1. Flash the Telemetry
...
image
...
and load it
...
on RPi board
...
2. Configure the CLOUDURL parameter and Log Server/Http Server parameter by providing IP address of XConf server in the two mentioned files /etc/include.properties and /etc/dcm.properties respectively.
For ex. In include.properties file:
CLOUDURL=http://35.155.171.121:9092/xconf/swu/stb?eStbMac=
In dcm.properties file:
DCM_LOG_SERVER_URL=http://35.155.171.121:9092/loguploader/getSettings
DCM_HTTP_SERVER_URL=http://35.155.171.121/xconf/telemetry_upload.php
DCM_LA_SERVER_URL=http://35.155.171.121/xconf/logupload.php
3. After board boot up, disable log rotation by using the command:
| Code Block | ||||
|---|---|---|---|---|
| ||||
systemctl disable rdkbLogMonitor |
4. Verify the image version: cat /version.txt
5. Perform reboot: reboot -f
Important Note:
Disabling log monitor is required because log rotation feature will wipe out logs when threshold reached, due to which telemetry feature can't able to identify the event count.
Telemetry functionality requires rdk logs.
To bring both log rotation and telemetry feature at same time, user needs to increase the threshold size of max size which is used by log rotation feature . Please follow Log Rotation Support in RPI User manual - Broadband - 2019 M8 to change threshold size of log rotation.
Below steps are to check telemetry log whenever box boots up ( after first time boot ) :
1. Verify tftp server is running and XConf DCM and Telemetry Permanent profile is configured properly (see Telemetry User manual for XConf side configuration for Telemetry)
2. After reboot, verify Telemetry log: cat /rdklogs/logs/telemetry.log
3. Verify that rtl_json.txt
...
and zipped log files for all other logs displayed in tftp server
4. Verify that rtl_json file and zipped log files for all other logs displayed in AWS(http) server(http://35.155.171.121/xconf/upload)
...