RDK Resources
[*RDK Preferred*]
Code Management Facility
RDK Forums
[RDK Conferences]
RDK Support
Archives
Papers & Presentations Archive![]()
Papers & Presentations Archive![]()
...
8. Go to the menu Telemetry and click on Permanent profile and create one with different markers (for ex. PAM, WIFI, PSM etc.) and select particular content (string) from the log file and provide in the "Content" field. Mention the log file name in the "type" field, skip frequency is 0.
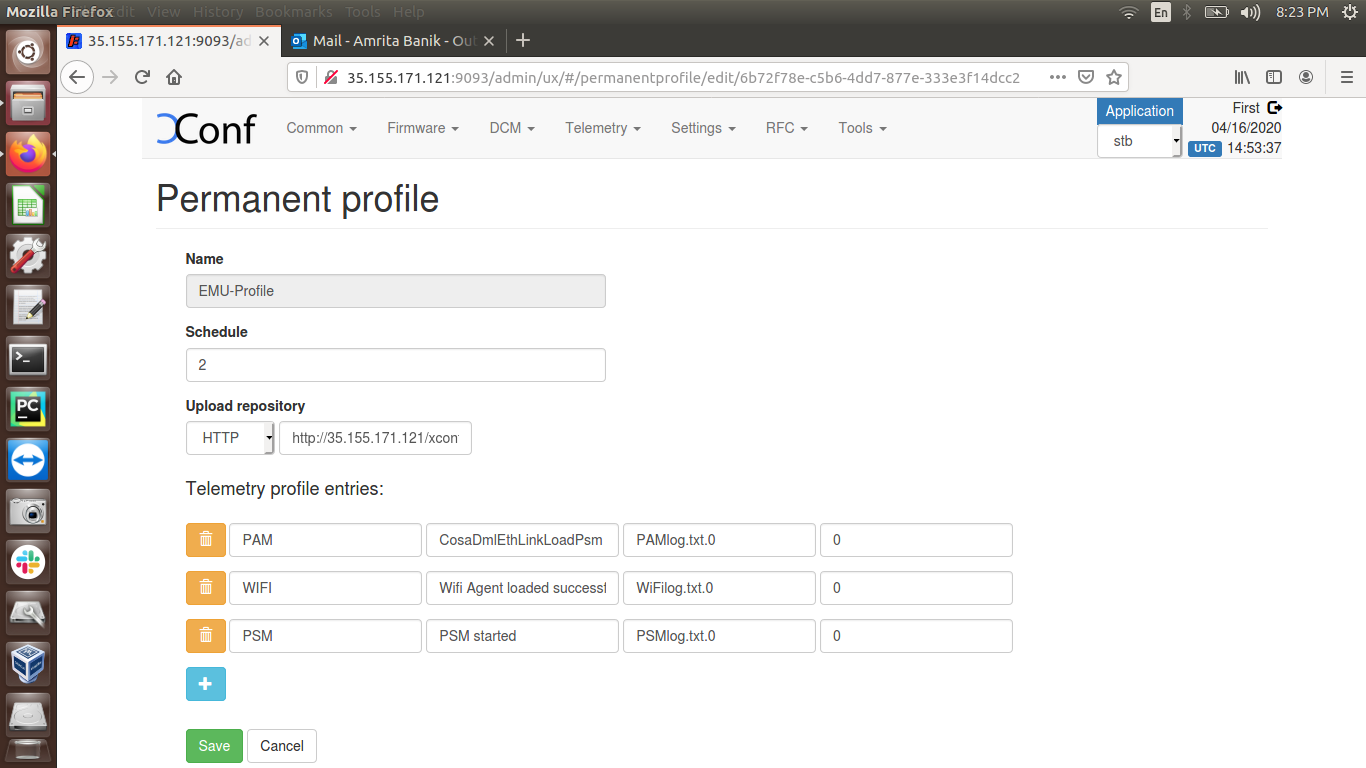
Telemetry profile entries -
First field is “Header” - This is the name for the particular logs collection. This is a custom name and can be decided based on the use case or error condition or any other scenario.
Second field is “Content” - This is the "log message string" that appears in the RDK logs.
Third field is “type” - This is the name of the log file where the above log message string needs to be searched.
Fourth field is “Skip frequency” - This is a skip frequency. It can have values like 0, 1, 2 etc.
0 - This particular log message is never skipped.
1 - Skip every alternate occurrence of this log message.
2 - Skip 2 consecutive log message occurrences and then collect 1 occurrence and then again skip 2 occurrences.
9. Create Targeting Rules from Telemetry menu item, provide the MAC address of eth0 interface and select the Permanent profile created in above step.
...
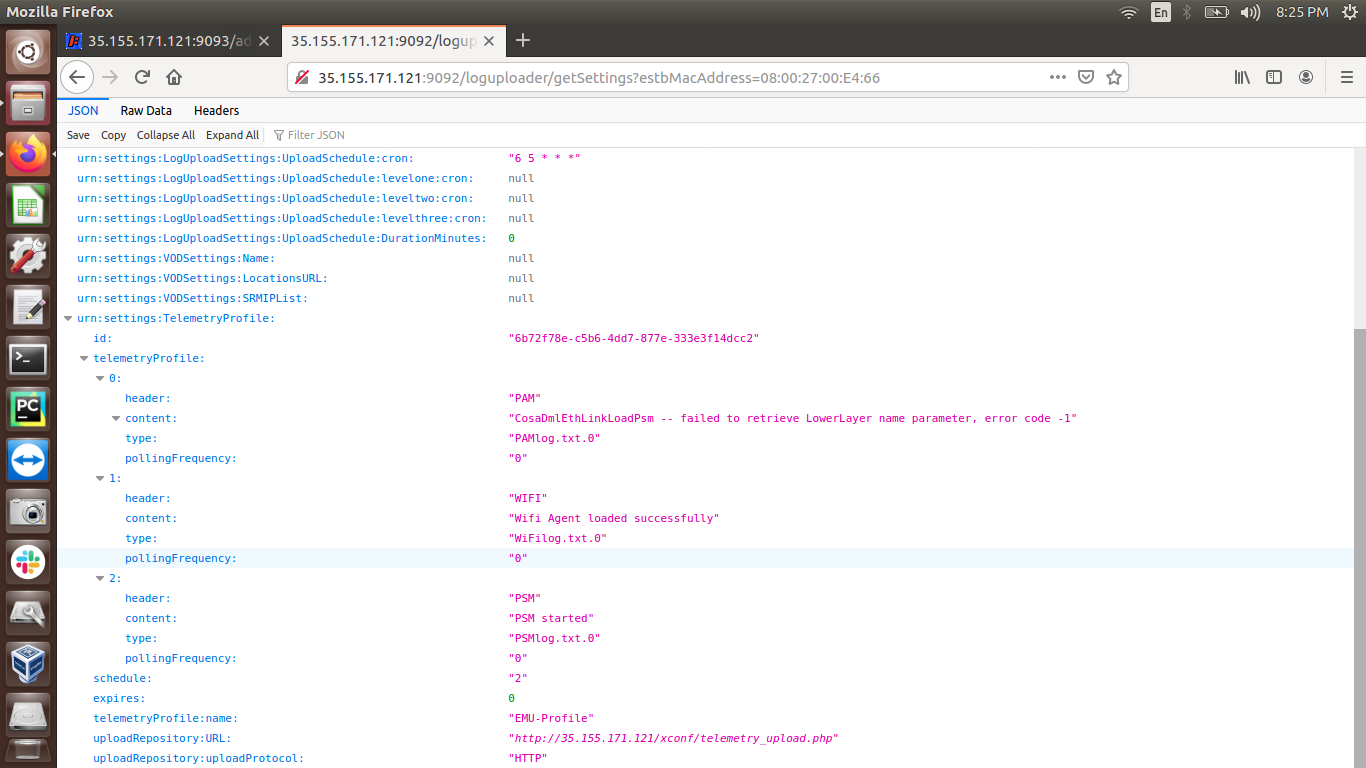
The markers (for example, PAM, WIFI, PSM) mentioned in the Permanent profile (ex. EMU-Profile) are listing under Telemetry profile
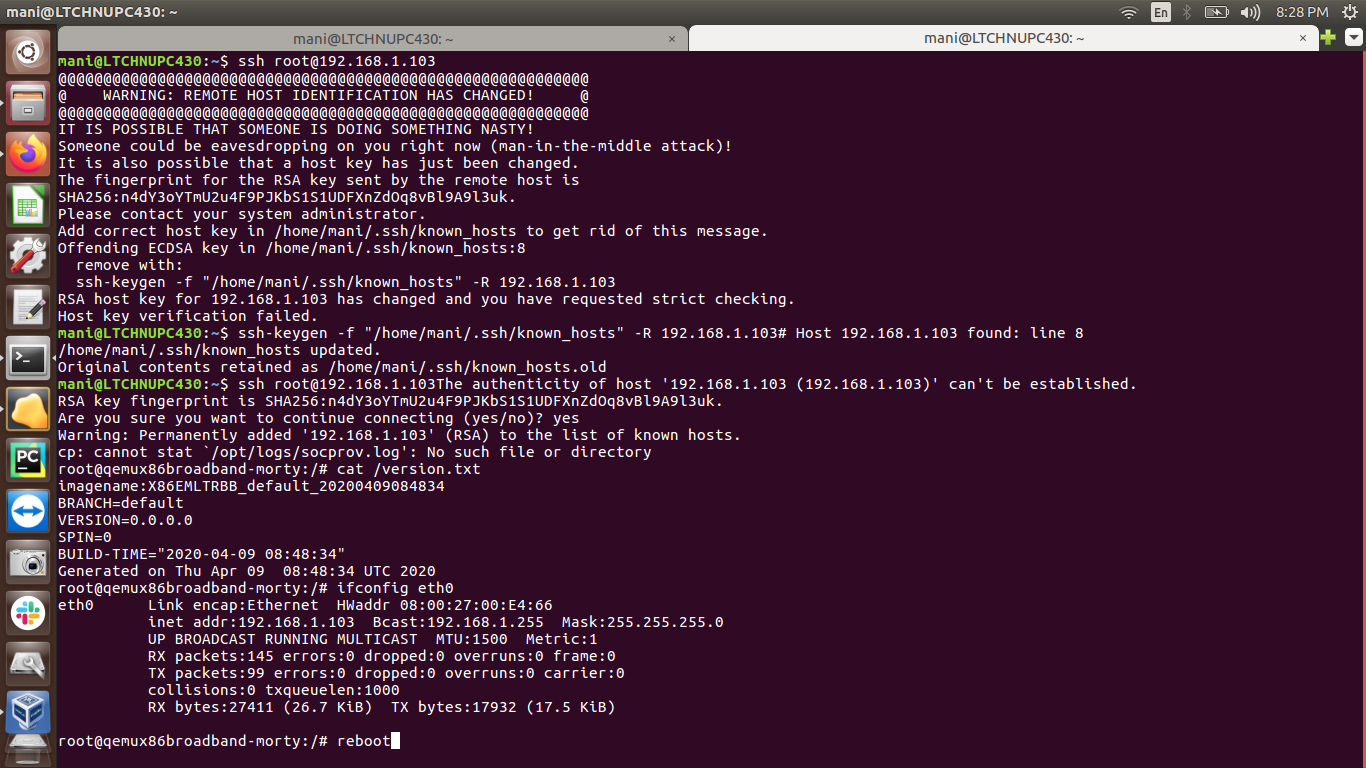
Login to the EMU using ssh to eth0 IP address from local terminal and perform "reboot" operation
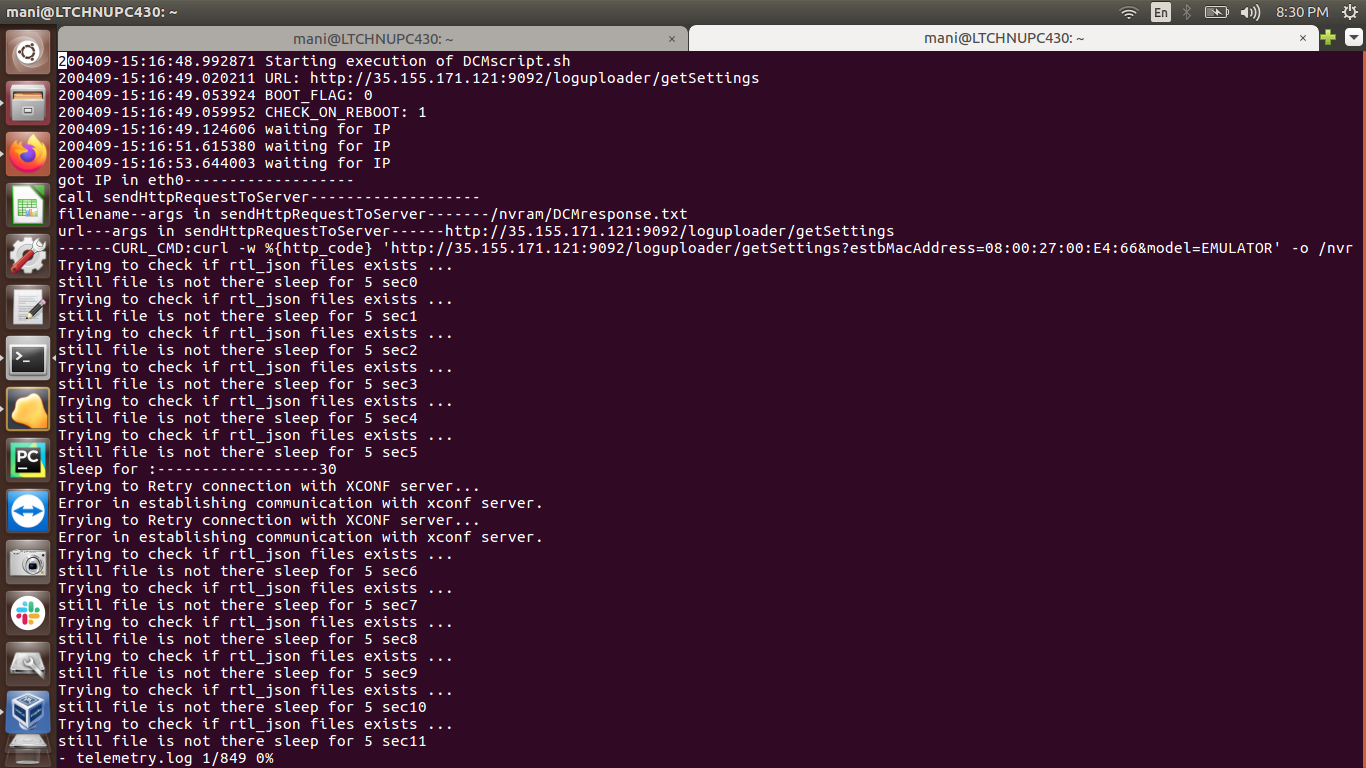
1.Verify the Telemetry log file (telemetry.log) is created under the path cd /rdklogs/logs. Content of this log file will display the log upload URL with MAC address of eth0 interface and model (for ex. EMULATOR)
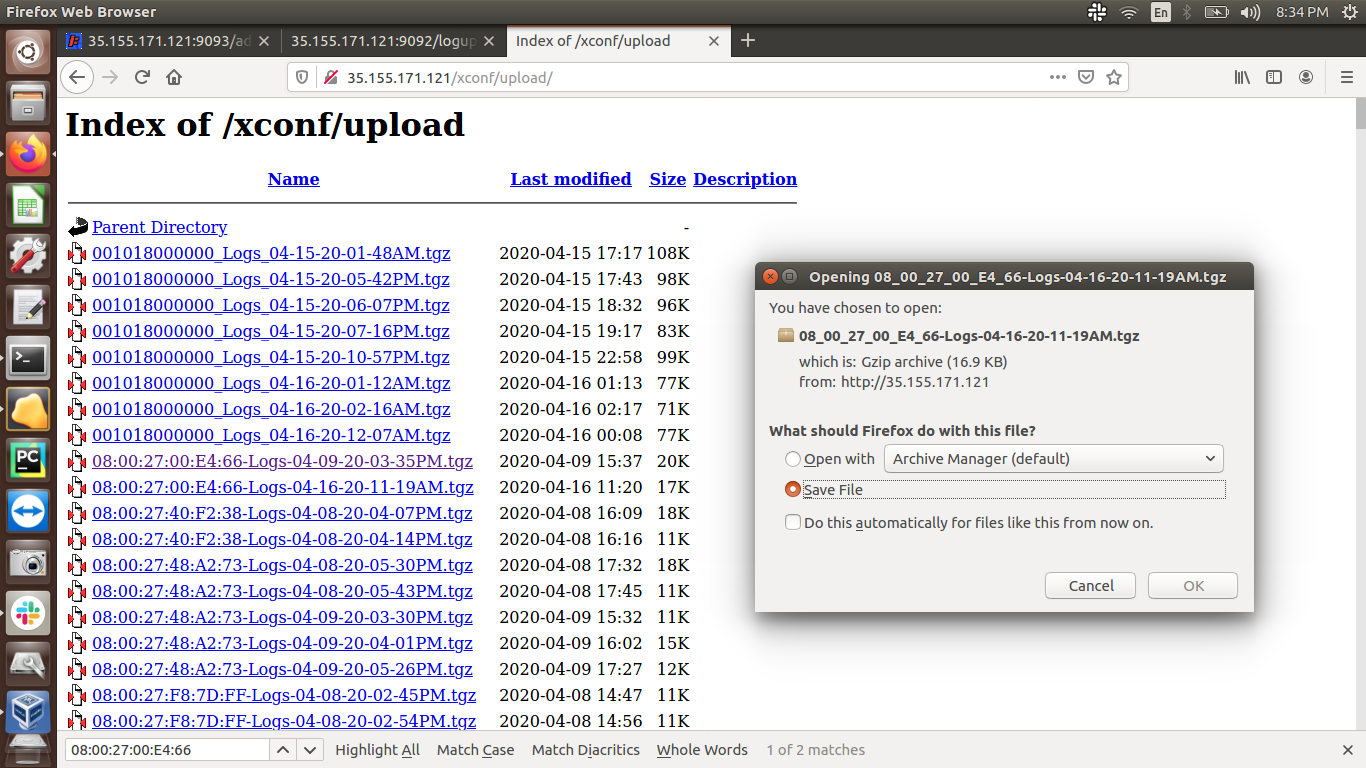
2. Go to the URL of http server (for ex. http://35.155.171.121/xconf/upload) and verify that .tgz file and .json file with MAC Address of eth0 interface is mentioned in the file name, and these files are available in that URL page. (Note: It will take some time to upload the .tgz log files and .json file in the http server)
3. Download the .tgz file then extract and verify all the device log files are available there.
4. Open the .json file as mentioned in the URL below:
/http://35.155.171.121/xconf/upload/08002700E466_TELE_04-16-2020-03-01PM.json