RDK Resources
[*RDK Preferred*]
Code Management Facility
RDK Forums
[RDK Conferences]
RDK Support
Archives
Papers & Presentations Archive![]()
Papers & Presentations Archive![]()
Telemetry is the automatic recording and transmission of data from remote or inaccessible sources to an IT system in a different location for monitoring and analysis.
1. Xconf Server
2. Virtual box version 6.0 loaded with RDK Broadband Emulator (EMU) image
3. http Server
EMU will connect to Xconf Server to get the device configuration information, telemetry profile information and log upload repository (URL of http server). It will search for the markers (contents mentioned in the permanent profile) in the mentioned log file. If it is found in the log file, it will process those information and create a text file and upload that file in the http server. This way all the critical data related to device health will be available on timely basis in the http server for further analysis.
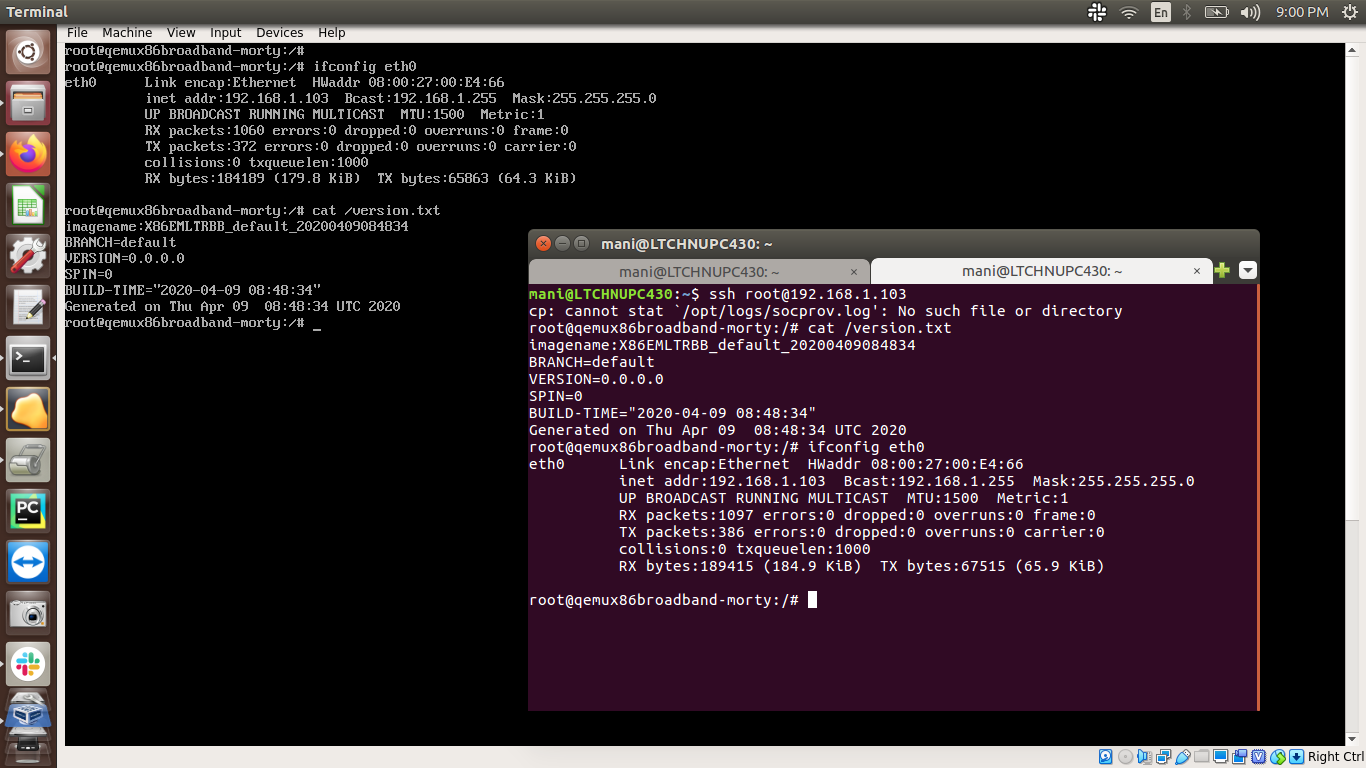
1. Load the RDKB-EMU image in Virtual box and once image boots up, take a note of HWaddr (MAC address) and IP address of interface eth0. Login to the EMU box by doing ssh to eth0 IP address from local host terminal.
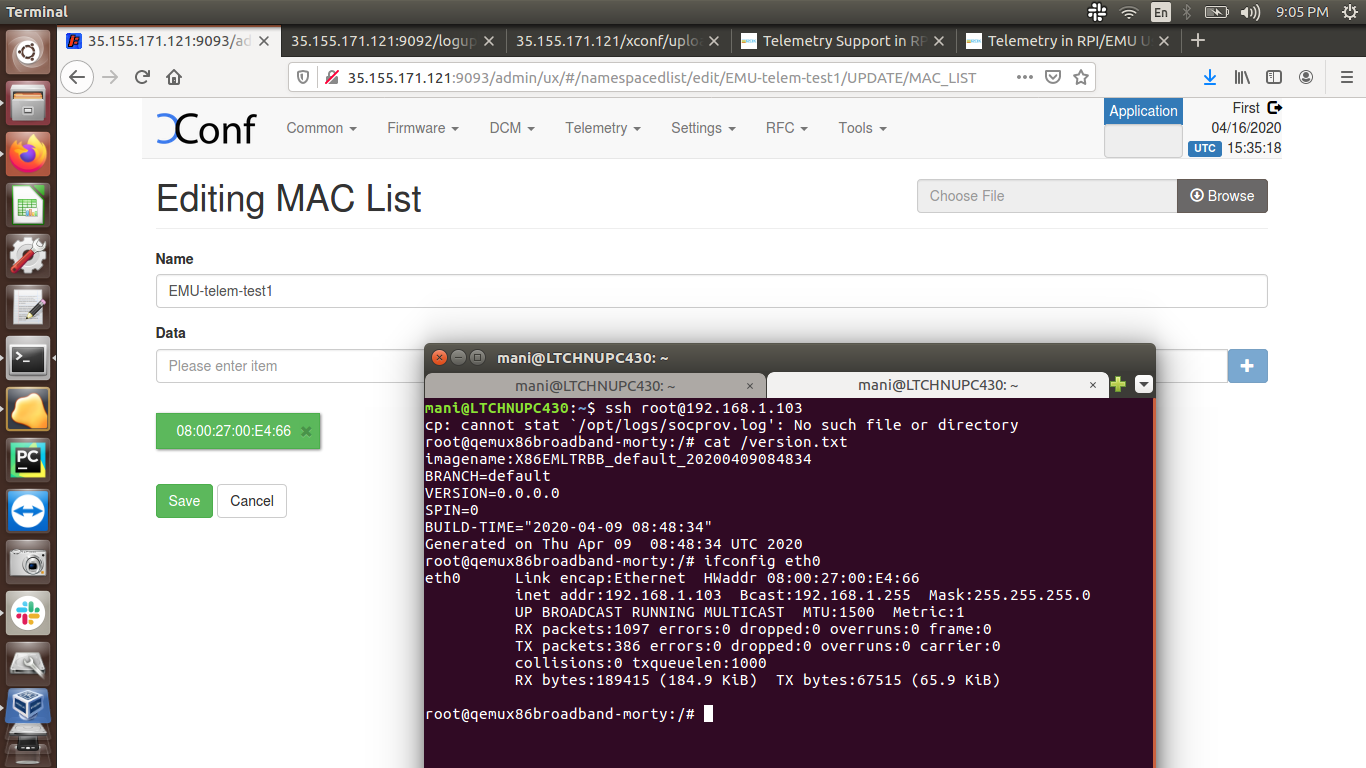
2. Open the XConf URL page and add the MAC address there.
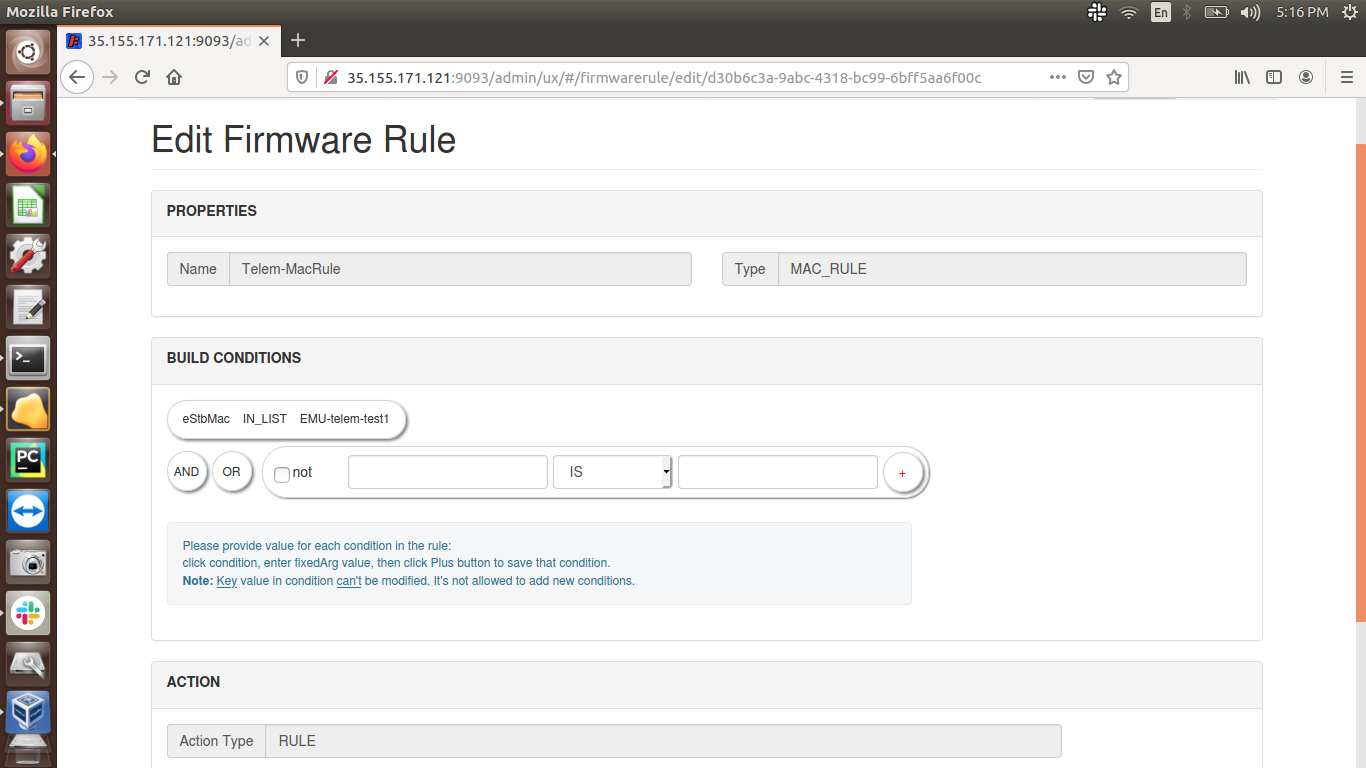
3. Create Firmware rule (type: MAC rule) with MAC address of interface eth0 of EMU.
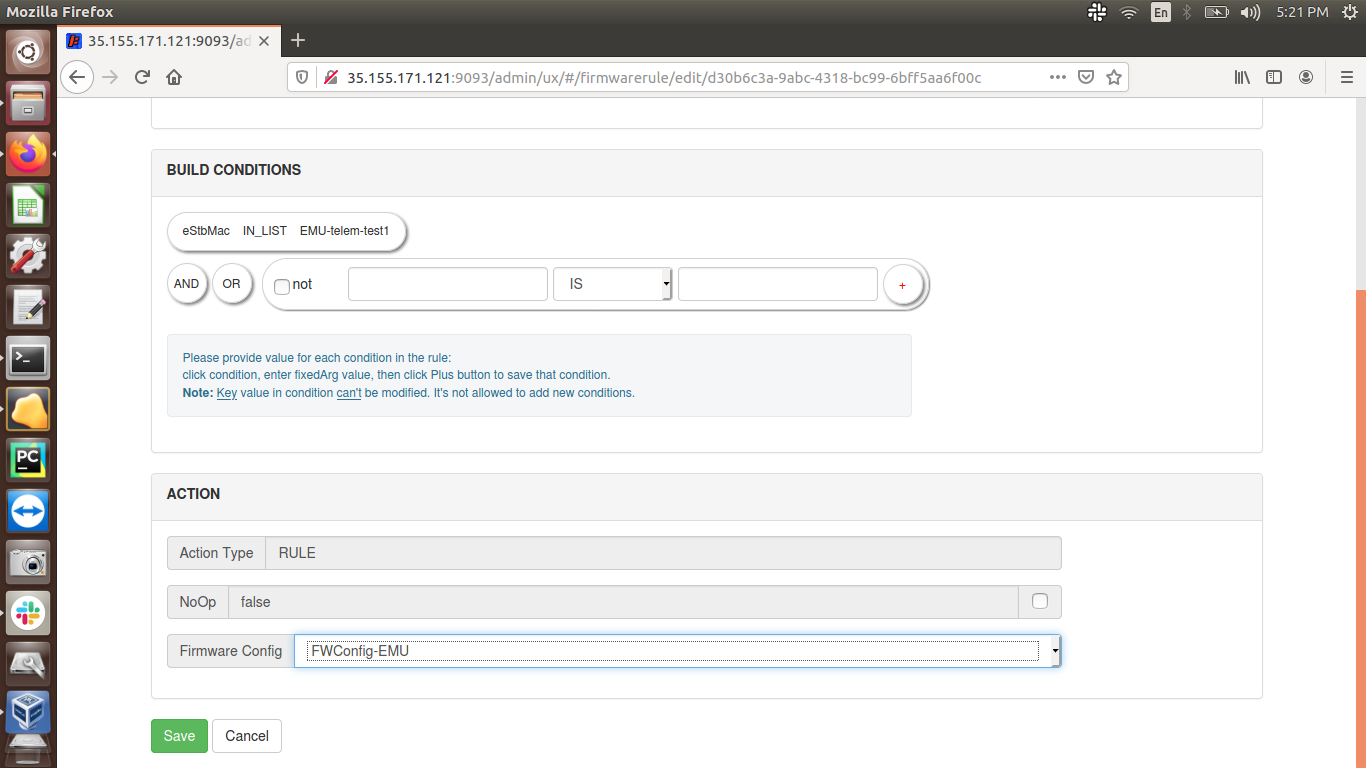
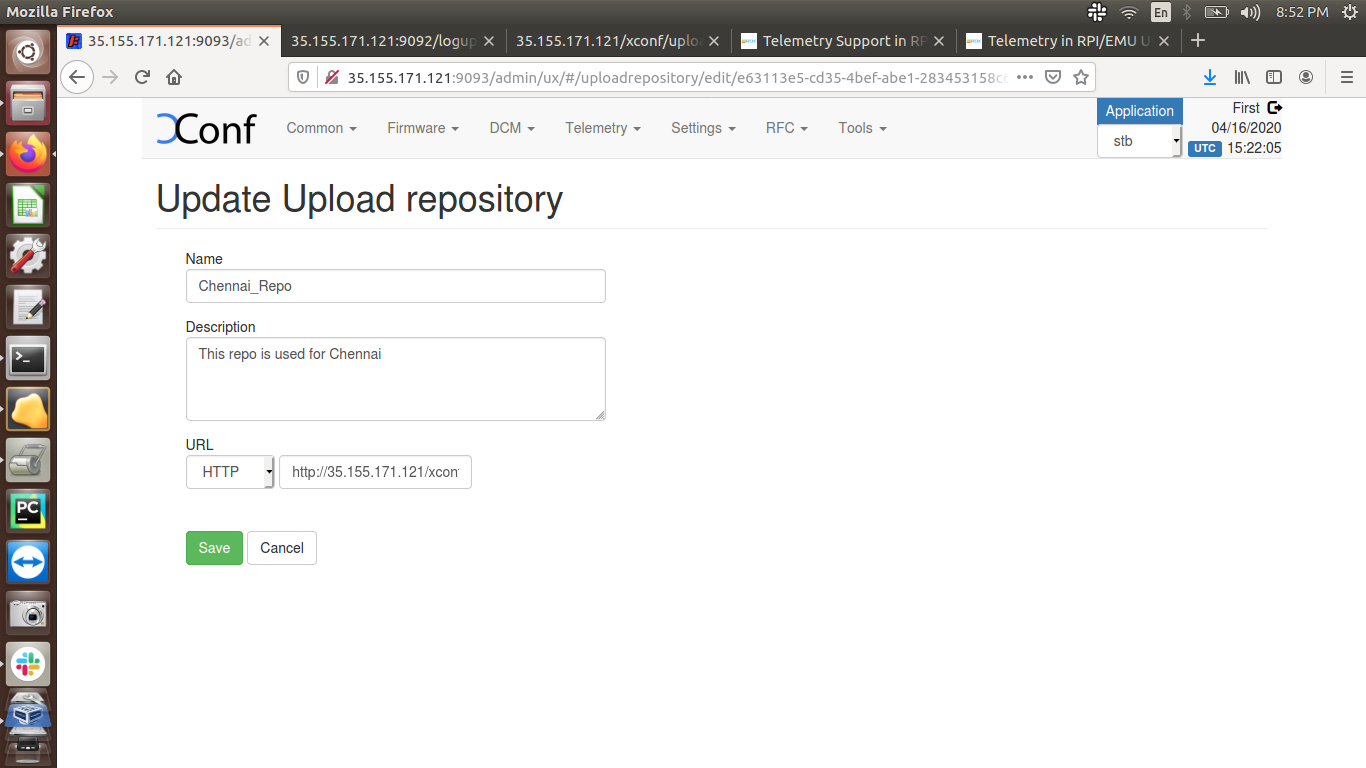
4. Select the Application: 'stb'. Go to DCM → Upload repository, create a repository by providing http protocol with http URL.
5. Create a formula under DCM → Formula → Click on 'Create' button

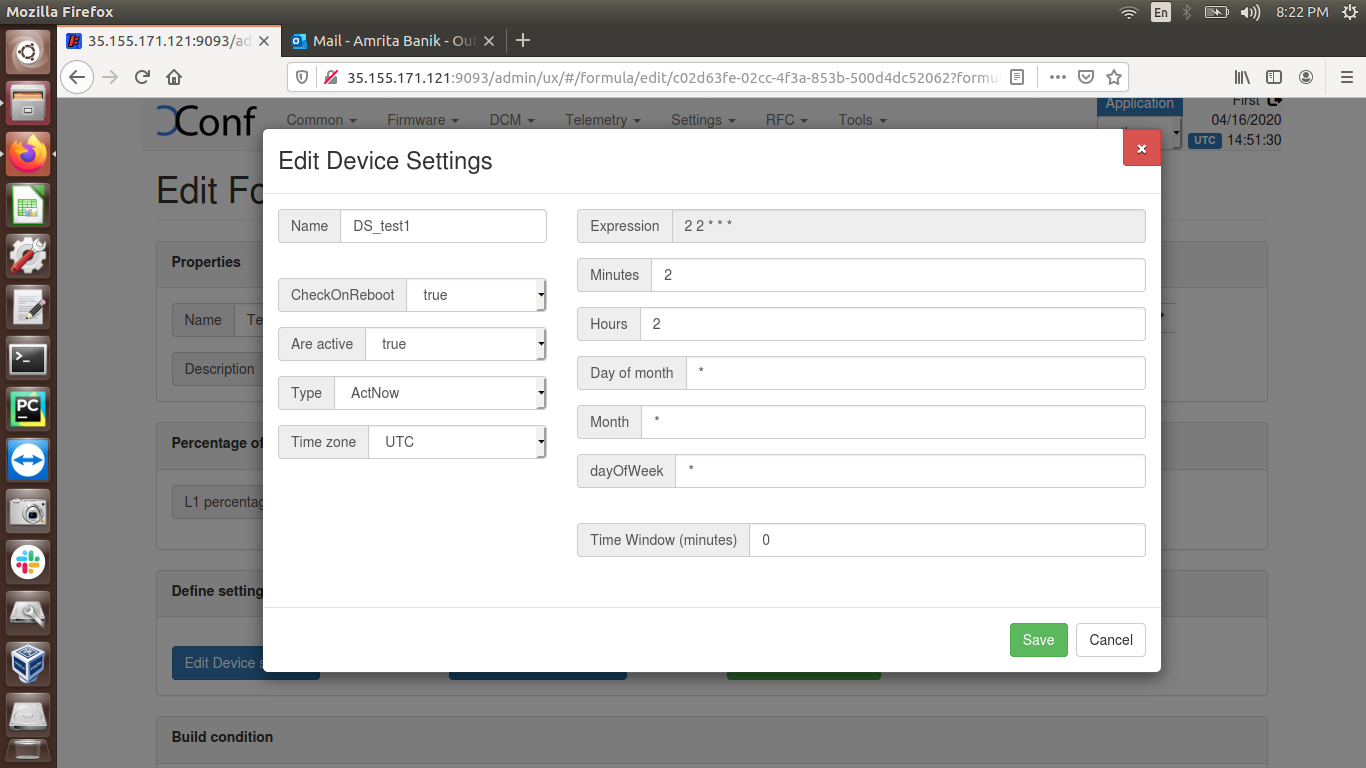
6. Edit Device settings
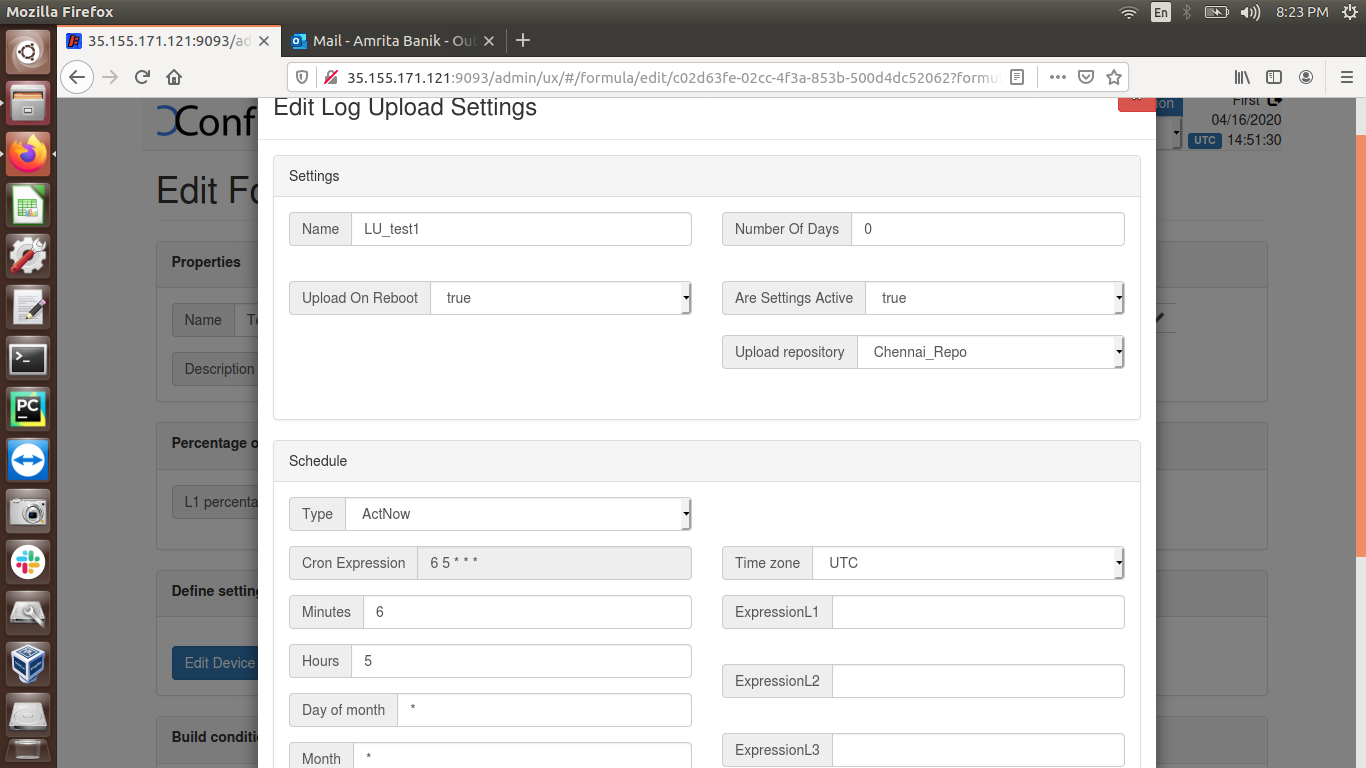
7. Edit Log Upload settings and save the formula
8. Go to the menu Telemetry and click on Permanent profile and create one with different markers (for ex. PAM, WIFI, PSM etc.) and select particular content (string) from the log file and provide in the "Content" field. Mention the log file name in the "type" field, skip frequency is 0.
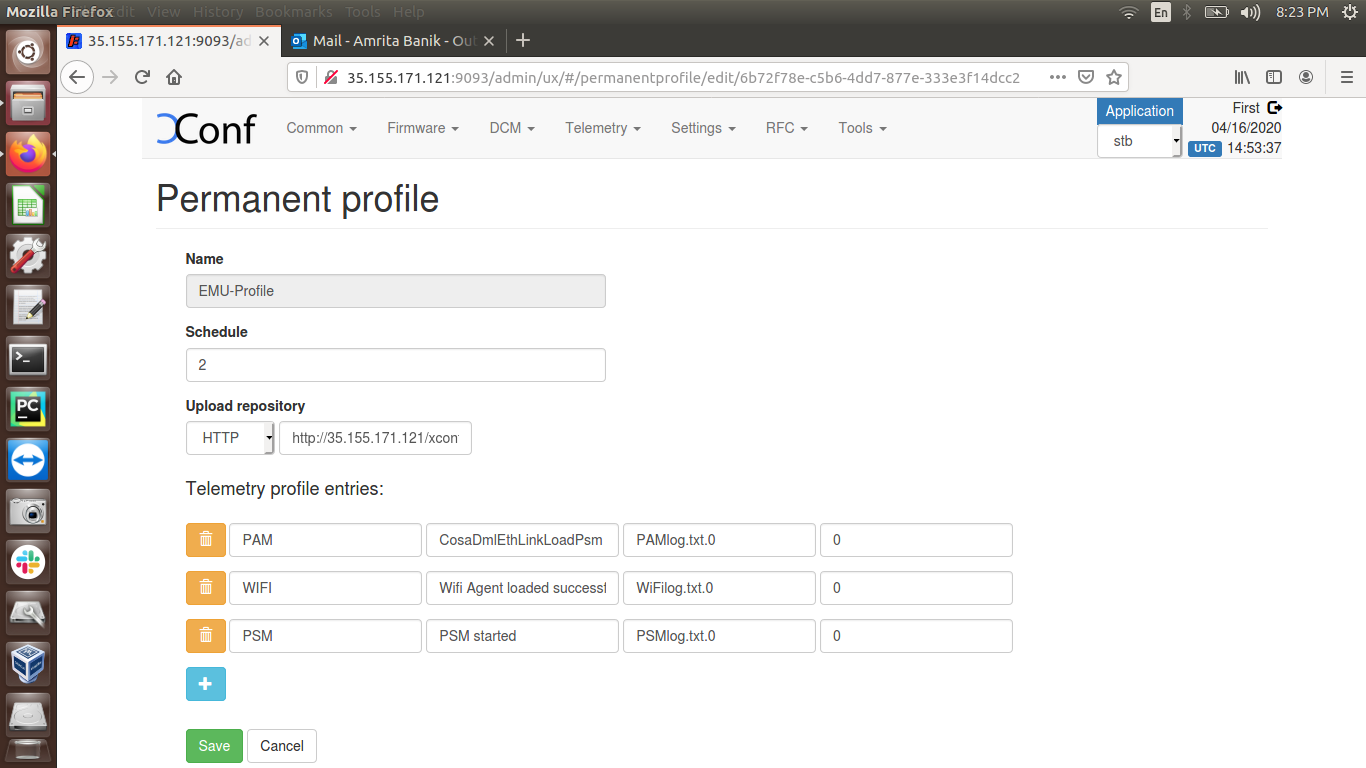
Telemetry profile entries -
First field is “Header” - This is the name for the particular logs collection. This is a custom name and can be decided based on the use case or error condition or any other scenario.
Second field is “Content” - This is the "log message string" that appears in the RDK logs.
Third field is “type” - This is the name of the log file where the above log message string needs to be searched.
Fourth field is “Skip frequency” - This is a skip frequency. It can have values like 0, 1, 2 etc.
0 - This particular log message is never skipped.
1 - Skip every alternate occurrence of this log message.
2 - Skip 2 consecutive log message occurrences and then collect 1 occurrence and then again skip 2 occurrences.
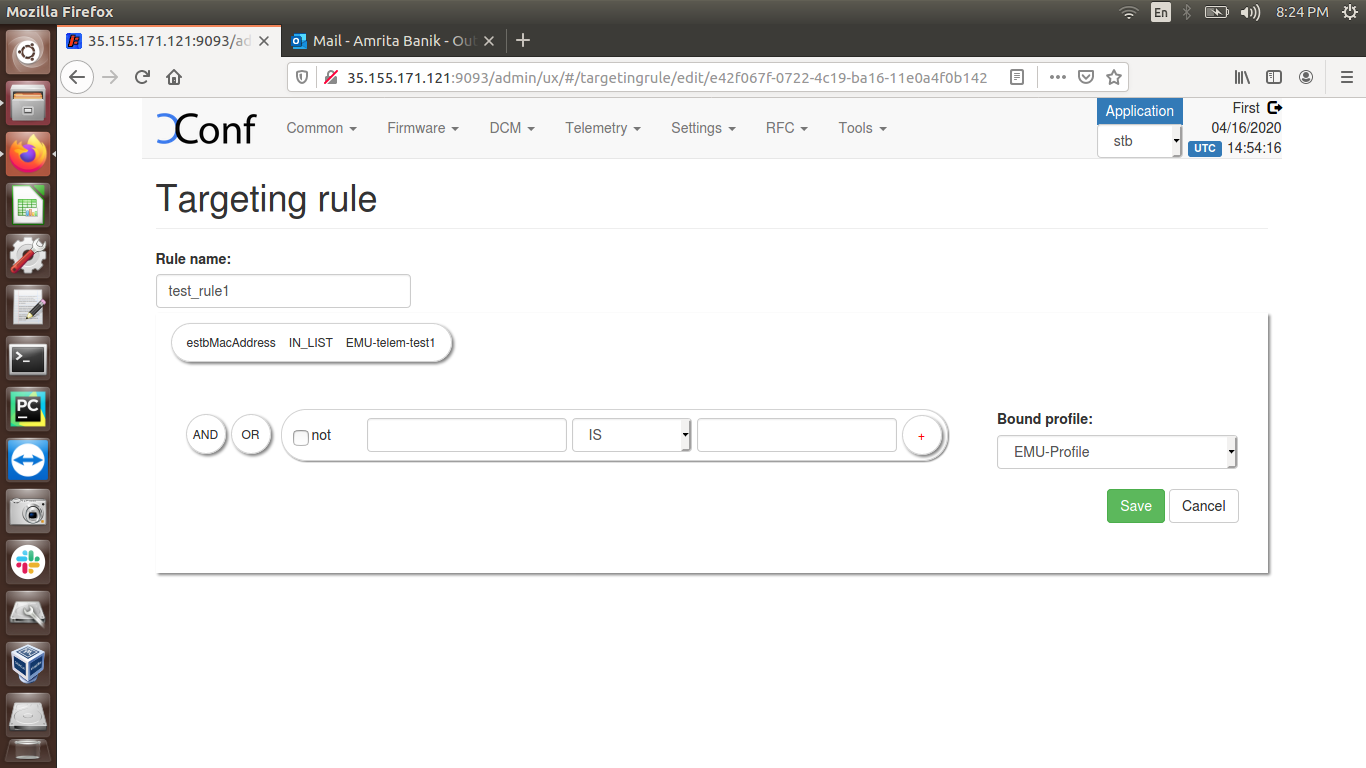
9. Create Targeting Rules from Telemetry menu item, provide the MAC address of eth0 interface and select the Permanent profile created in above step.
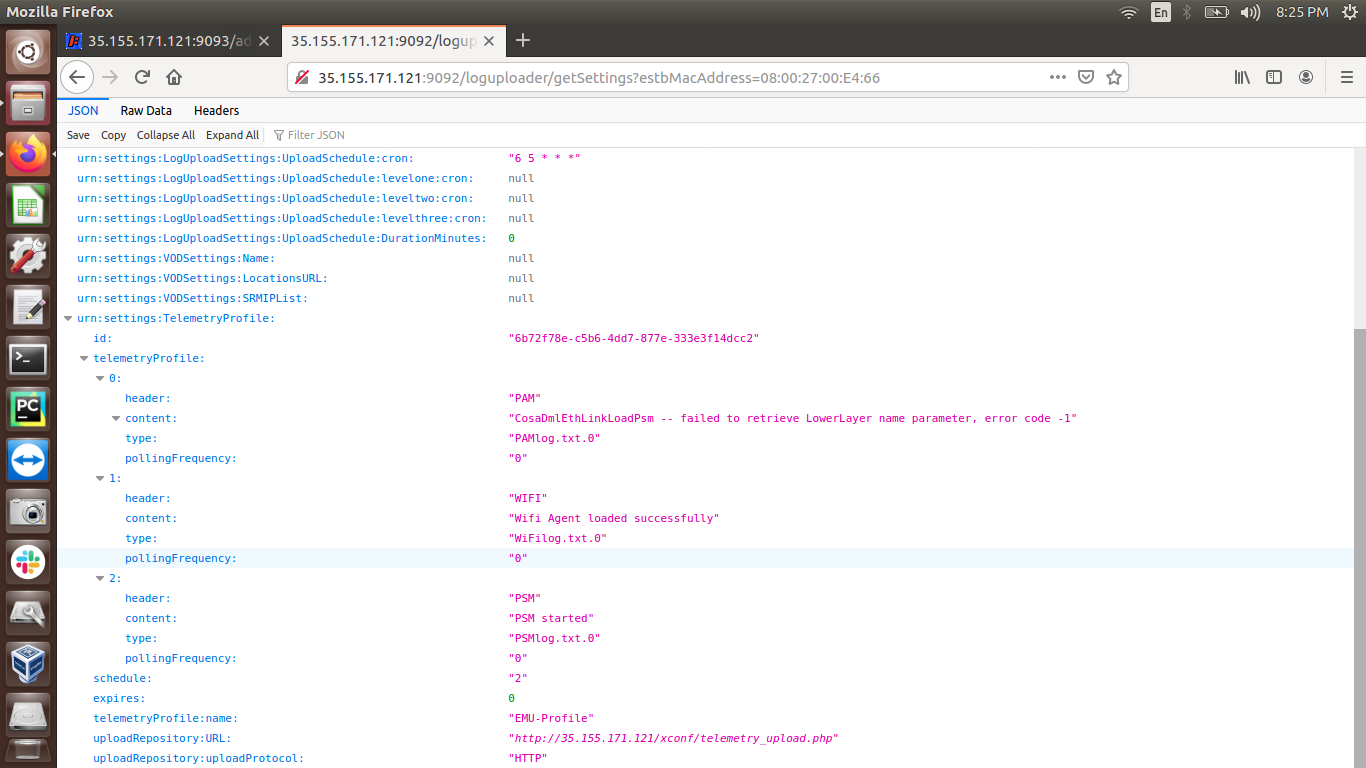
10. Verify that data related to telemetry is displayed under the URL as mentioned : http://35.155.171.121:9092/loguploader/getSettings?estbMacAddress=<MAC address of eth0 interface>
The markers (for example, PAM, WIFI, PSM) mentioned in the Permanent profile (ex. EMU-Profile) are listing under Telemetry profile
Login to the EMU using ssh to eth0 IP address from local terminal and perform "reboot" operation
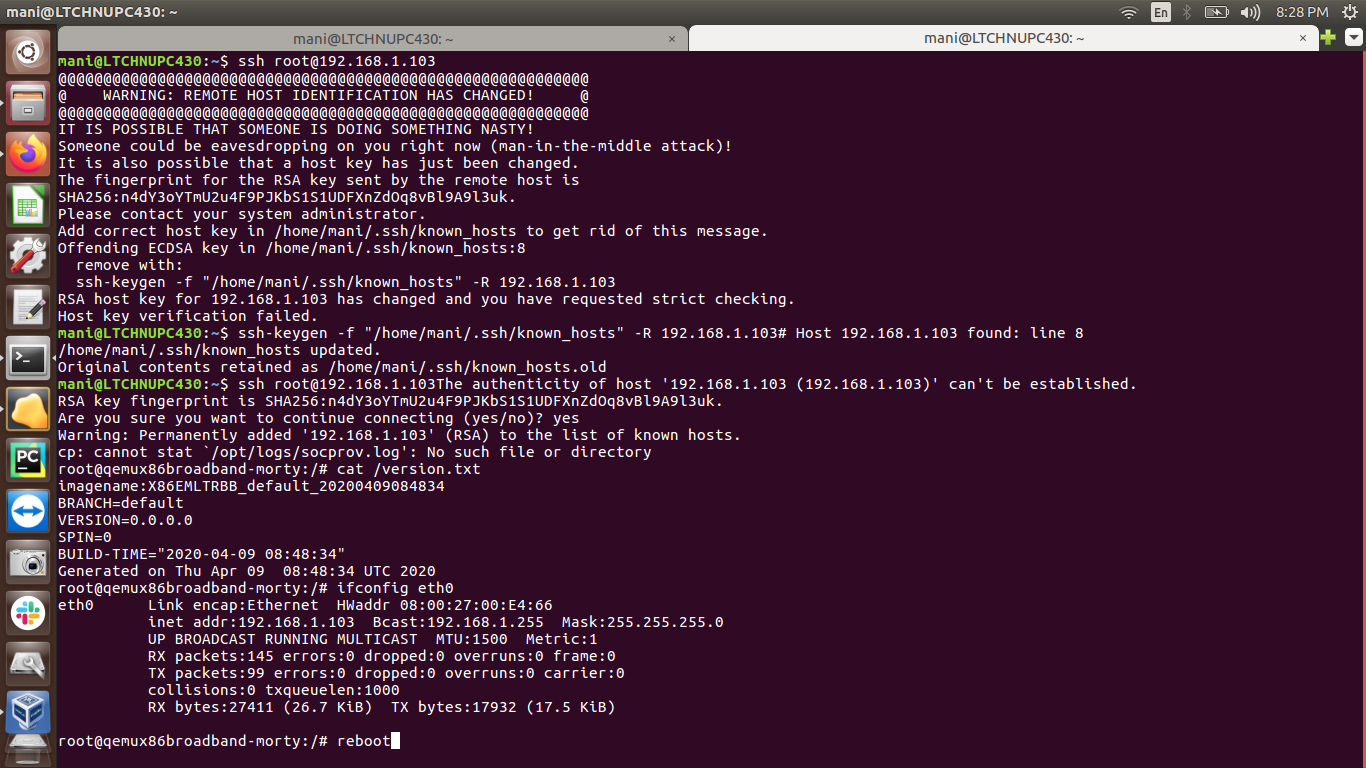
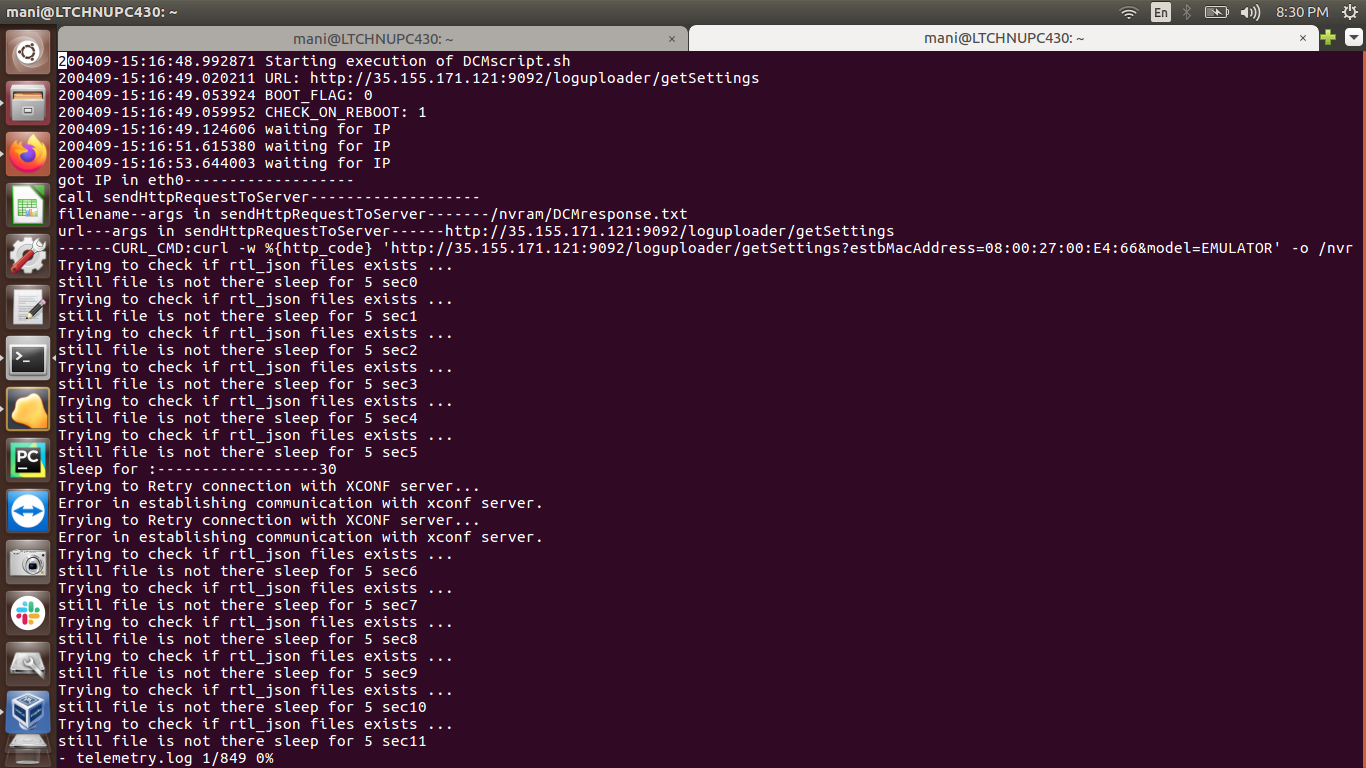
1.Verify the Telemetry log file (telemetry.log) is created under the path cd /rdklogs/logs. Content of this log file will display the log upload URL with MAC address of eth0 interface and model (for ex. EMULATOR)
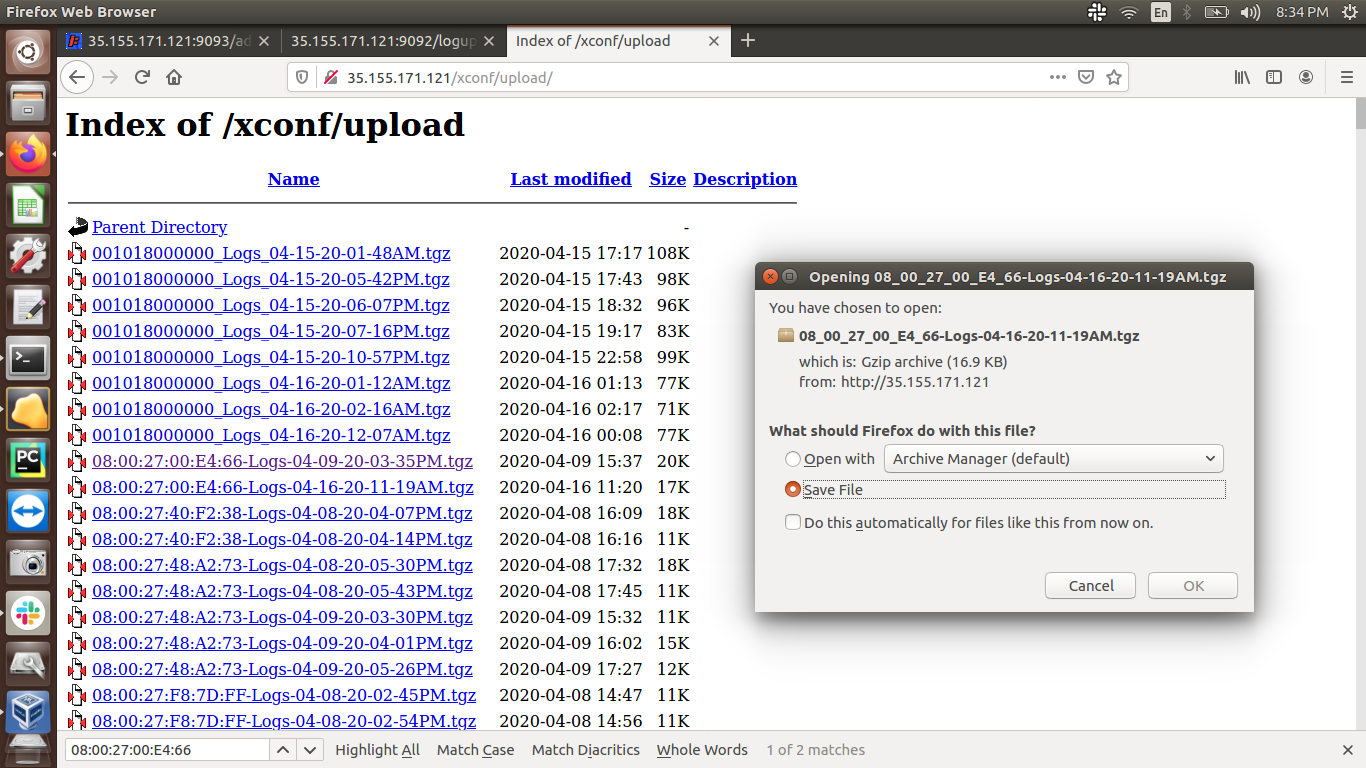
2. Go to the URL of http server (for ex. http://35.155.171.121/xconf/upload) and search with MAC address of eth0 interface (for .tgz - search with colon in the MAC address and for .json, search removing the colons in the MAC address) verify that .tgz file and .json file with MAC Address of eth0 interface is mentioned in the file name, and these files are available in that URL page. (Note: It will take some time to upload the .tgz log files and .json file in the http server)
3. Download the .tgz file then extract and verify all the device log files are available there.

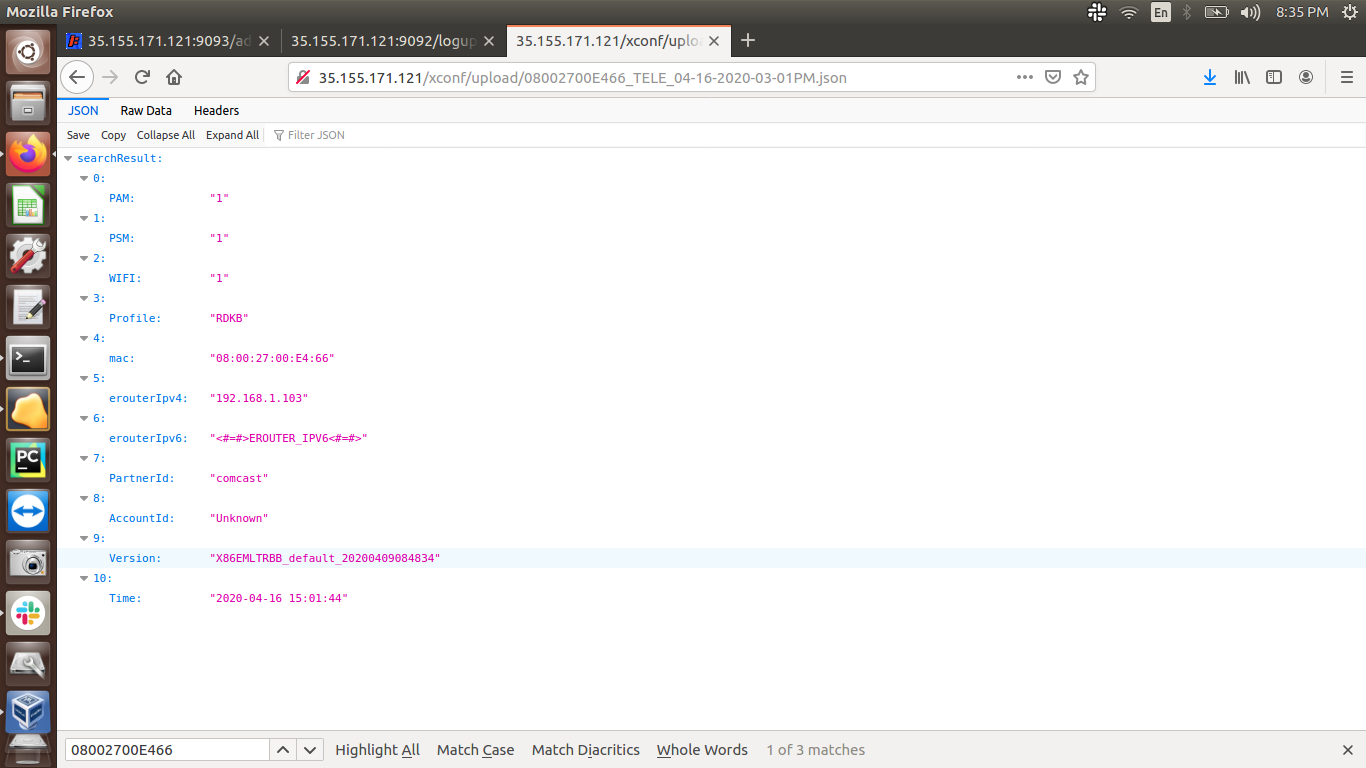
4. Open the respective .json file in the browser and verify the markers as mentioned in the Permanent profile and IP address of EMU box and image version will be displayed:
/http://35.155.171.121/xconf/upload/<MAC address of eth0>_TELE_04-16-2020-03-01PM.json