RDK Resources
[*RDK Preferred*]
Code Management Facility
RDK Forums
[RDK Conferences]
RDK Support
Archives
Papers & Presentations Archive![]()
Papers & Presentations Archive![]()
...
| Panel |
|---|
It takes a minidump and its corresponding text-format symbols and produce a symbolized stacktrace. minidump_stackwalk minidump.dmp gpsample_app.sym |
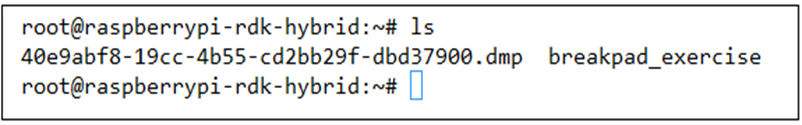
uploadDumps.sh collects core dumps/ mini dumps to crash server whenever any applications crashes.
Sample Application
| Code Block |
|---|
#include "client/linux/handler/exception_handler.h“
static bool dumpCallback(const google_breakpad::MinidumpDescriptor& descriptor,
                         void* context,
                         bool succeeded)
{
  printf("Dump path: %s\n", descriptor.path());
  return succeeded;
}

void crash()
{
  volatile int* a = (int*)(NULL);
  *a = 1;
}


int main(int argc, char* argv[])
{
  google_breakpad::MinidumpDescriptor descriptor("/tmp");
  google_breakpad::ExceptionHandler eh(descriptor,
                                       NULL,
                                       dumpCallback,
                                       NULL,
                                       true,
                                       -1);
  crash();
  return 0;
}
|
To compile the source
| Panel |
|---|
PKG_CONFIG_PATH=../ all: breakpad_exercise.c @ $(CXX) -std=c++11 breakpad_exercise.c -g -o breakpad_exercise `pkg-config --cflags breakpad` -L./client/linux/ -lbreakpad_client -I./ -lpthread |
Execute the sample application
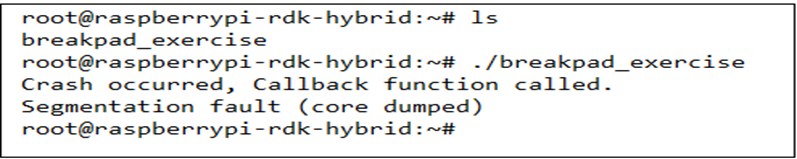
Core dump files generated after an uncaught signal in a process (as a SIGSEGV or SIGQUIT), are generated in the base directory where the program was executed, and the core dumps starts with the name as “core” or “core.PID”.
...
| Panel |
|---|
After you get inside the gdb-prompt, (on execution of the above command), type; (gdb) bt full |
...