RDK Resources
[*RDK Preferred*]
Code Management Facility
RDK Forums
[RDK Conferences]
RDK Support
Archives
Papers & Presentations Archive![]()
Papers & Presentations Archive![]()
| Table of Contents |
|---|
See information about integrating Breakpad and creating minidump in Breakpad integration to RDK-V component
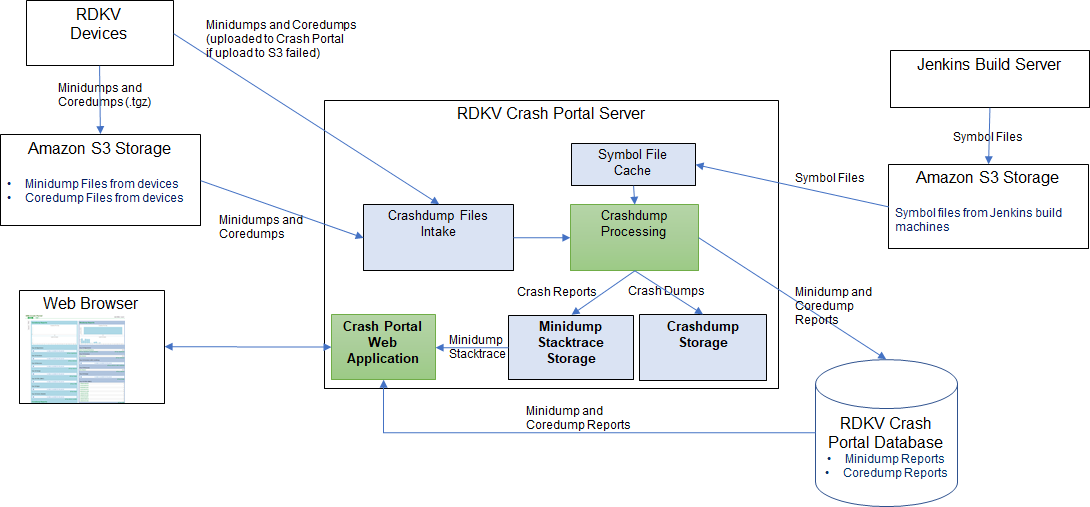
Crash upload component helps in uploading the crashes (coredump or minidump files) that happened in the set-top boxes to the crash portal server(which can be configured). Crash portal collects crash dumps and logs which happened in the connected STBs, process these and provide a meaningful backtrace.
...
dump-backup.service invokes /lib/rdk/core_shell.sh which is responsible for calling uploadDumps.sh script to upload the crash dump to crash portal server.
echo "|$RDK_PATH/core_shell.sh %e %s %t" >/proc/sys/kernel/core_pattern
uploadDumps.sh script collects the following and compresses it to create a .tgz format
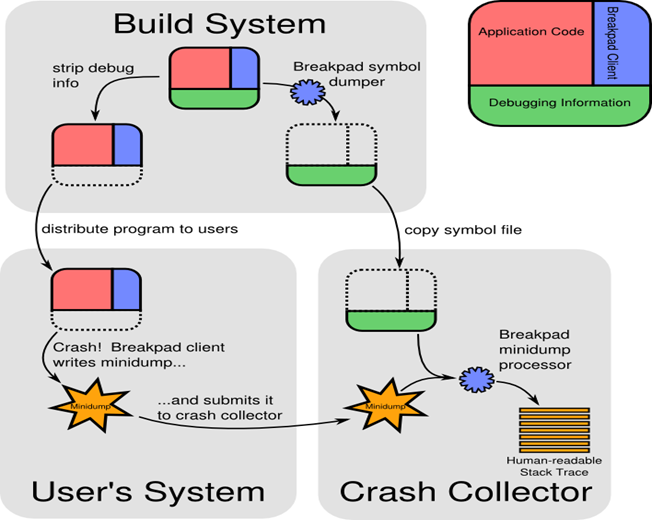
Google Breakpad
Breakpad is a library that records crashes in compact "minidump" files. It produce C and C++ stack traces from minidumps. Breakpad can also write minidumps on request for programs that have not crashed.
How to Integrate Google Breakpad library?
Link against libbreakpad_client library.
#include "client/linux/handler/exception_handler.h“
| Code Block |
|---|
#include "client/linux/handler/exception_handler.h“ // Include Header file for exception handler
static bool dumpCallback(const google_breakpad::MinidumpDescriptor& descriptor, void* context, bool succeeded)
{
  printf("Dump path: %s\n", descriptor.path());
  return succeeded;
}

int main(int argc, char* argv[])
{
  google_breakpad::MinidumpDescriptor descriptor("/tmp");
  google_breakpad::ExceptionHandler eh(descriptor, // Minidump will be saved in /tmp
                                       NULL,
                                       dumpCallback, //Callback
                                       NULL,
                                       true,
|
Google Breakpad Utilities
| Panel |
|---|
| dump_syms ./gpsample_app > gpsample_app.sym, will generate symbol file. |
...
It takes a minidump and its corresponding text-format symbols and produce a symbolized stacktrace.
minidump_stackwalk minidump.dmp gpsample_app.sym
...
CrashPortal URL should be configured in the /lib/rdk/uploadDumps.sh script
eg:
PORTAL_URL="35.155.171.121:80"
REQUEST_TYPE=17
Sample Application
| Code Block |
|---|
#include "client/linux/handler/exception_handler.h“
static bool dumpCallback(const google_breakpad::MinidumpDescriptor& descriptor,
                         void* context,
                         bool succeeded)
{
  printf("Dump path: %s\n", descriptor.path());
  return succeeded;
}

void crash()
{
  volatile int* a = (int*)(NULL);
  *a = 1;
}


int main(int argc, char* argv[])
{
  google_breakpad::MinidumpDescriptor descriptor("/tmp");
  google_breakpad::ExceptionHandler eh(descriptor,
                                       NULL,
                                       dumpCallback,
                                       NULL,
                                       true,
                                       -1);
  crash();
  return 0;
}
|
To compile the source
| Panel |
|---|
PKG_CONFIG_PATH=../ all: breakpad_exercise.c @ $(CXX) -std=c++11 breakpad_exercise.c -g -o breakpad_exercise `pkg-config --cflags breakpad` -L./client/linux/ -lbreakpad_client -I./ -lpthread |
Execute the sample application
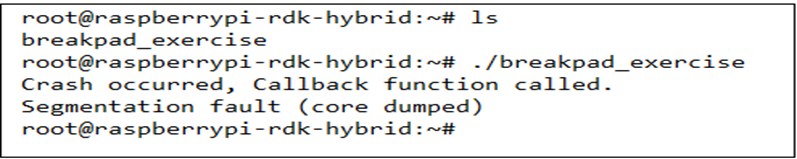
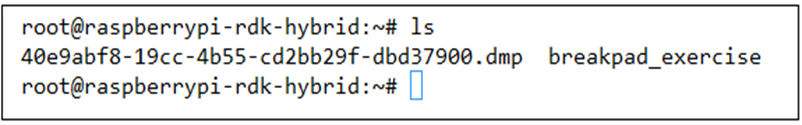
Core dump files generated after an uncaught signal in a process (as a SIGSEGV or SIGQUIT), are generated in the base directory where the program was executed, and the core dumps starts with the name as “core” or “core.PID”.
By default size of the core will be zero, To generate the core, we need to set the size of the core to unlimited.
By default, core will be generated in the current directory with the file name "core". We can change the core generating directory from current directory to another by editing the kernel configuration file core pattern(/proc/sys/kernel/core_pattern) in the kernel.
echo "newpattern" > /proc/sys/kernel/core_pattern
Core pattern is helpful in the case if there are couple of core dumps files in one directory and we don't know which program caused it.
How to get stack trace?
Make sue the executable is compiled with -g option to turn on the debugging symbols
...
gdb <executable_path> <coredump_file_path>
After you get inside the gdb-prompt, (on execution of the above command), type;
...