RDK Resources
[*RDK Preferred*]
Code Management Facility
RDK Forums
[RDK Conferences]
RDK Support
Archives
Papers & Presentations Archive![]()
Papers & Presentations Archive![]()
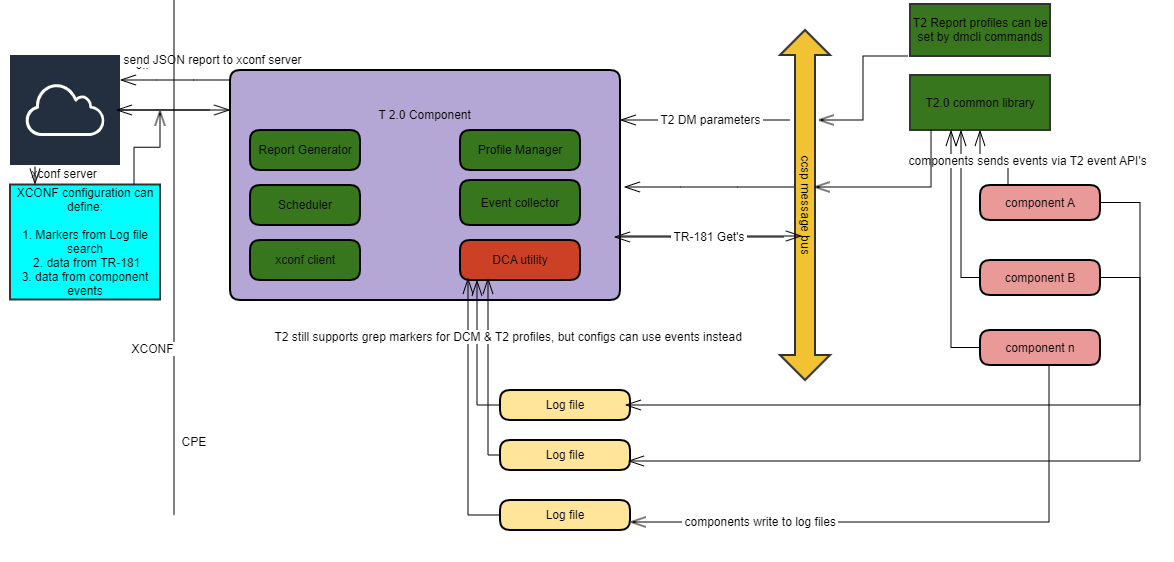
As part of Telemetry 2.0 , a marker event system has been added to reduce grepping of log files and to improve telemetry handling performance. Following are major aspects of the marker event system:
Configuration
The XConf/DCM response TelemetryProfile definition has been extended to indicate the source of a marker for report generation is the event system. When the TelemetryProfile "type" field equals "<event>" the T2 component will not include the marker in the log file grep process. If the "type" field is set to "<event>", then the "content" field is set to the name of the component.
When the T2 component converts a TelemetryProfile to a report profile at .BulkData.Profile.{i}. it creates a Parameter.{i}. entry for each marker . The Use field is set for marker event handling by the T2 component.
Example
Existing marker with log file as the source:
"telemetryProfile": [{
    "header": "SYS_SH_WIFI_restart",
     "content": "WIFI_process is not running",
     "type": "SelfHeal.txt.0",
     "pollingFrequency": "0"
 },
Updated marker with event feed as the source; "type" and "content" field are changed:
"telemetryProfile": [{
  "header": "SYS_SH_WIFI_restart",
   "content": ""com.cisco.spvtg.ccsp.wifiagent"",
   "type": "<event>",
   "pollingFrequency": "0"
},
Processing
A shared library is used by components to send targeted marker occurrences through an event feed to the T2 component.Components using the shared library shall conditionally compile it in via #if defined(ENABLE_FEATURE_TELEMETRY2_0) in order to support platform-specific compilation.When the T2 component receives a marker event it processes the marker name and value according to the Use definition in the report profile. The T2 component will store absolute as received, accumulate, or aggregate values. Marker events are processed per report profile.
When a report is generated markers that were processed from the event feed are included in the report as specified by the report profile.
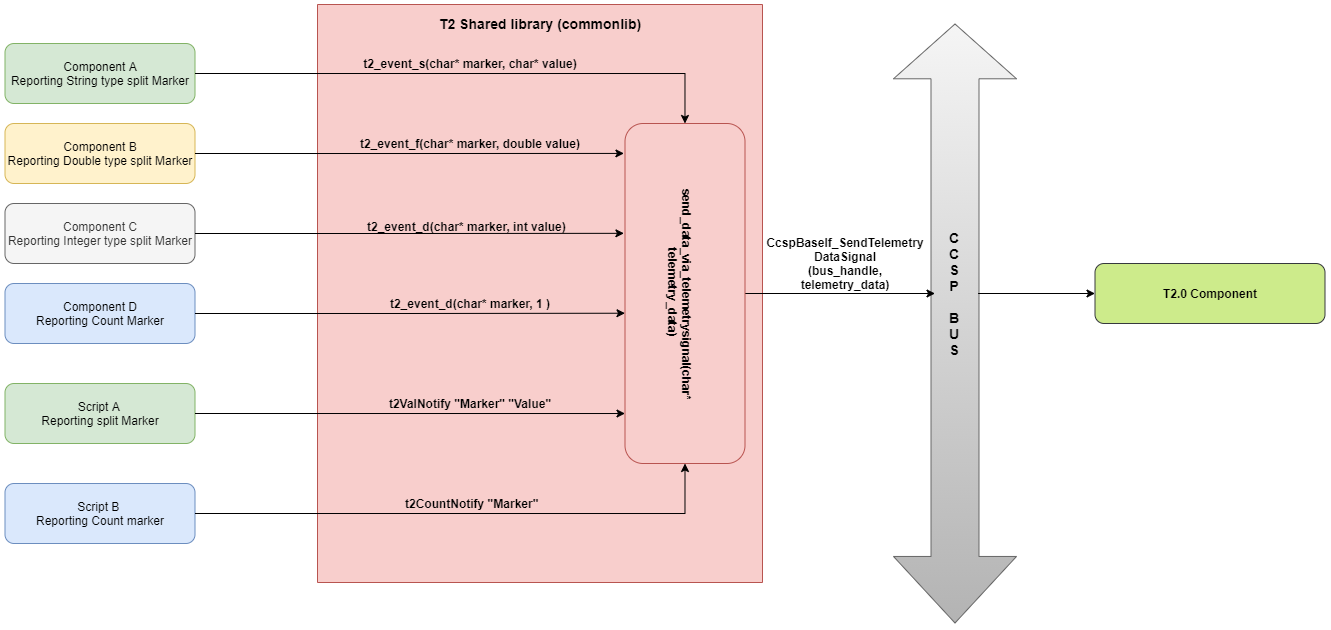
•APIs for component metrics and events
| t2_event_s(char*eventName, char* value) t2_event_d(char*eventName, int value) t2_event_f(char*eventName, double value) |
|---|
| S.NO | DataModel | Description | DataType |
|---|---|---|---|
| 1 | Device.DeviceInfo.X_RDKCENTRAL-COM_RFC.Feature.Telemetry.Enable | Enable the T2 Process | Boolean |
| 2 | Device.DeviceInfo.X_RDKCENTRAL-COM_RFC.Feature.Telemetry.Version | ‘2.0’ : Operates only with legacy support | String |
| 3 | Device.DeviceInfo.X_RDKCENTRAL-COM_RFC.Feature.Telemetry.ConfigURL | https://xconf.xcal.tv/loguploader/getT2Settings | String |
T2 Report Profile
| S.NO | DataModel | Description | DataType |
|---|---|---|---|
| 1 | Device.X_RDKCENTRAL-COM_T2.ReportProfiles | Value must be a JSON configuration blob | String |
| 2 | Device.X_RDKCENTRAL-COM_T2.ReportProfilesMsgPack | Value must be a JSON configuration blob in base 64 encoded msgpack format | String |
The markers are of 3 types .
1.Split based markers.
2. Count based markers
3. TR-181 based markers.
Marker Type | Sample configuration from xconf | Description with respect to sample configuration |
|---|---|---|
| Count based markers | {"header":"RF_ERROR_IPV6PingFailed","content":"Ping to IPv6 Gateway Address are failed","type":"SelfHeal.txt.0","pollingFrequency":"0"} | Expects the occurrence count of content "Ping to IPv6 Gateway Address are failed" |
| Split based markers | {"header":"bootuptime_ClientConnectComplete_split","content":"Client_Connect_complete:","type":"LM.txt.log","pollingFrequency":"0"} | Expects the value after content "Client_Connect_complete:" |
| TR-181 based markers | {"header" : "CMMAC_split","content" : "Device.DeviceInfo.X_COMCAST-COM_CM_MAC","type" : "<message_bus>","pollingFrequency":"48"} | Markers whose type is configured as "<message_bus>" |
In T2.0, the aim is to instrument possible number of split and count based markers from component side. These are termed as event markers. Can be classified as one more type under the classification of markers.
Once a marker is instrumented from component side, its configuration on xconf will be changed from the configured file name to "<event>" in 'type:' section.
Example:
{"header":"bootuptime_ClientConnectComplete_split","content":"ccsp-lm-lite","type":<event>","pollingFrequency":"0"}